Previous releases
The following releases have been released for 8x8 Analytics for Contact Center in the recent past.
In this release of 8x8 Analytics for Contact Center, we are introducing the following enhancements:
- Enhanced reporting metrics in the Detailed Reports
- Ability to filter by repeated interactions
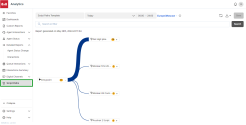
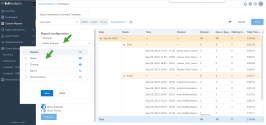
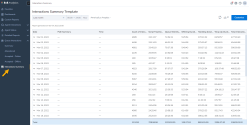
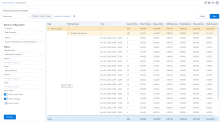
- Introduction of the interaction flow in the Detailed Reports
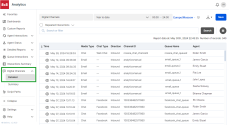
- Ability to access recordings of customer interactions in the Detailed Reports
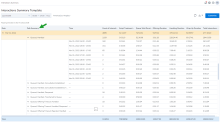
- Introduction of a new Script Paths report
- Introduction of the Customer Experience Digital Channels Detailed Report
- Introduction of the Post Call Survey Public API
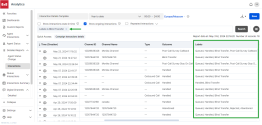
- Reporting for Agent-to-agent chat transfer
-
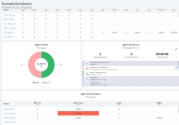
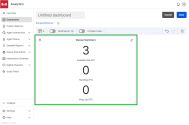
Display metrics as a large number for the Agent Performance and Queue Summary real-time widgets
- Updates to the navigation sidebar
Enhanced reporting metrics in the Detailed Reports
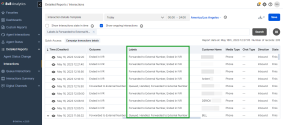
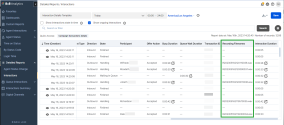
We recently introduced new metrics in the Interactions Detailed report to enable supervisors to have better insight into their customer's journey. They include:
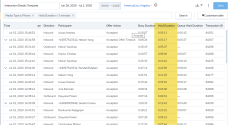
- Customer Journey Duration: This metric lists the time duration that a customer spent on an interaction (such as script time, time in a queue, handling time, time on hold, and post call survey time). The value for this metric is not displayed for old data.
- Participant Group ID: This metric enables the supervisor to see the unique identifier of the specific group the agents are part of.
- Participant Group Name: This metric enables the supervisor to see the name of the specific group the agents are part of.
To learn more about these metrics, see new reporting metrics for customer journey.
Ability to filter by repeated interactions
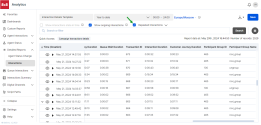
We recently introduced a new feature that allows supervisors to filter by repeated interactions in the Interactions Detailed report. As a supervisor, you are able to filter these interactions by the customer’s name, phone number, email address, or social media ID. To learn more, see filter report for repeated interactions.
Introduction of the interaction flow in the Detailed Reports
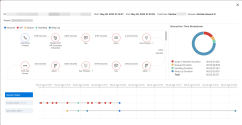
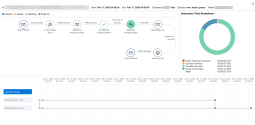
To have a better understanding of all the events that took place during an interaction, you can access a visual representation diagram that shows the end-to-end journey of an interaction. The interaction flow displays detailed information that you can use to improve customer experience and drive professional growth for your agents. To learn more, see access the interaction flow.
Ability to access recordings of customer interactions in the Detailed Reports
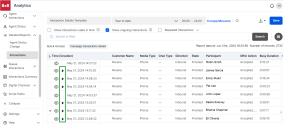
Supervisors now have the ability to access recordings of customer interactions. These recordings reside in the 8x8 Quality Management and Speech Analytics application, but can be accessed in the Interactions Detailed report. To learn more, see access recordings for customer interactions.
Introduction of a new Script Paths report
We recently introduced a new Script Paths report that displays a high-level view of your contact center's IVR. The numbers on each path represent the total number of calls going through that specific path. It helps you identify which IVR objects are used by your callers as expected and which paths are not. To learn more, see access the script paths report.
Introduction of the Customer Experience Digital Channels Detailed Report
We have introduced the Digital Channels Detailed report for chat and email interactions. This new report was originally available in Customer Experience. The report displays analytics associated with digital channels. It also offers a graphical view of the complete digital interaction journey from the time it enters the contact center until the time the interaction is terminated. You can access this report by navigating to the Digital Channels menu and selecting Detailed. To learn more, see access the digital channels reports.
Introduction of the Post Call Survey Public API
A Post Call Survey (PCS) is a questionnaire presented to the caller at the end of a call, typically to collect feedback about the quality of service offered by the company. Companies use a survey to gather feedback from customers, and analyze the collected data to help improve their services. You can get feedback on the overall product quality or service quality, get to know the customer satisfaction, and take corrective actions.
The Post Call Survey Public API will allow supervisors to configure endpoints that will enable them to gather valuable customer feedback. The PCS API contains three endpoints.
The Survey Summary
The Survey Summary is an aggregated endpoint. It contains multiple surveys, based on your selection. You can filter by agents, queues, and surveys. Some of the metrics associated with this endpoint include:
- Survey ID: It indicates a unique identifier associated with a survey.
- Survey name: It indicates the name associated with a survey.
- Achievable score: It indicates the maximum score that can be obtained for a specific survey. Skipped surveys are not counted when computing the achievable score.
- Actual score: This new metric indicates the score obtained for a survey.
- Completed: It indicates whether a survey is completed.
- Opted in: It indicates whether a customer chose to participate in a survey.
- Score: It indicates the ratio between the achievable score and the actual score. The value is represented as a percentage.
- Started: It indicates the date and time a customer started a survey.
The Survey Questions Summary
The Survey Questions Summary is an aggregated endpoint. It contains metrics that are available for each question on a survey. They include:
- Achievable score: It indicates the maximum score that can be obtained for a specific survey.
- Actual score: It indicates the score obtained for a survey.
- Answered: It indicates whether a customer answered a question on a survey.
- Hungup: It indicates whether a customer abandoned a survey.
- Invalid answer: It indicates whether a customer selected an invalid answer.
- Score: It indicates the score for each question.
- Skipped: It indicates whether a customer skipped a question on a survey.
- Valid answer: It indicates whether a customer selected a valid answer.
The survey score and respective answer for each question is displayed. The number of invalid answers provided for each question is compiled, along with the number of times a question was skipped.
The Detailed Reports Survey
The Detailed Reports Survey shows detailed information associated with a survey. It also displays metrics for agents, queues, interactions, transactions, questions, and surveys. The available survey types are:
- Callback: It indicates a call is placed to a customer in order to complete a survey.
- Stay on call: It indicates a customer remains on a call after an interaction, in order to complete a survey.
- Null: It indicates a customer call is configured in order to be forwarded directly to a survey.
Reporting for Agent-to-agent chat transfer
Agents can transfer chats to each other. For example, agent A answers a chat and decides to transfer it to agent B. Here are few scenarios:
- Scenario 1: Agent B is alerted and answers the chat
- Scenario 2: Agent A changes their mind and cancels the transfer
- Scenario 3: Agent B rejects the transfer
- Scenario 4: Agent B doesn’t answer the chat during the pre-selected alert time frame
As a supervisor, you have the ability to track agent to agent chat transfers for all these scenarios. The filter label used to identify chat transfers in the Interactions Detailed report is Blind Transfer.
The agent-to-agent chat transfer is also reflected in the following reports:
- Interactions Summary Report
- Digital Channels Detailed report
- Digital Channels Summary report
- Interaction Visual Journey
- Agent Status Change report
- Agent Interactions Summary report
Display metrics as a large number for the Agent Performance and Queue Summary real-time widgets
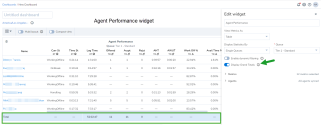
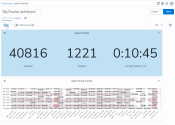
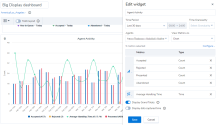
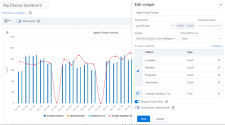
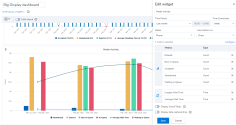
Real-time widgets allow you to access the key performance indicators for queues and agents in real time or in short time intervals. Whether you are tracking the number of agents available to take calls in real-time or the average waiting time in the last 30 minutes, get the data in real time using these real-time widgets. You can configure the Agent Summary and Queue Summary real-time widgets to display up to 3 metrics as a Big Number. This is ideal when displaying information on a large screen in a contact center.
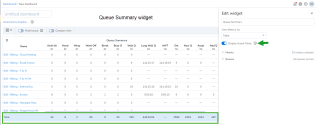
You can configure the Queue Summary real-time widget to display up to 3 metrics as a Big Number. This is ideal when displaying queue-related information on a large screen. It makes it easier for both agents and supervisors to view these real-time metrics.
To configure the queue summary widget:
- From the menu, go to Dashboards.
- Click New to create a new widget.
- Click
 and select Queue Summary from the drop-down menu.
 - The Add widget window appears. Specify a name for the widget.
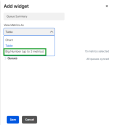
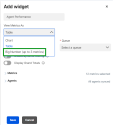
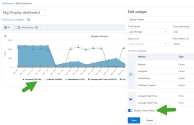
- From the View Metrics As drop-down list, select Big Number (up to 3 metrics).
- After selecting your desired metrics, click Save.
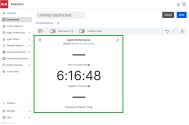
Information relevant to your selected metrics is displayed as large numbers.
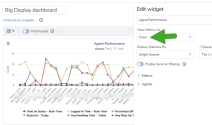
You can configure the Agent Performance real-time widget to display up to 3 metrics as a Big Number. This is ideal when displaying agent-related information on a large screen. It makes it easier for both agents and supervisors to view these real-time metrics.
To configure the agent performance widget:
- From the menu, go to Dashboards.
- Click New to create a new widget.
- Click
 and select Agent Performance from the drop-down menu.
 - The Add widget window appears. Specify a name for the widget.
- After making your selections, click Save.
Information relevant to your selected metrics is displayed as large numbers.
To learn more about configuring real-time widgets, see create a dashboard using widgets.
Other features
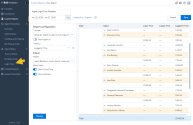
The navigation sidebar of the application has been enhanced to align with other 8x8 applications. You will notice a familiar look and feel, along with an updated 8x8 logo.
In this release of 8x8 Analytics for Contact Center, we are introducing the following enhancements.
Ability to view ongoing interactions
We recently introduced a new feature that allows supervisors to track ongoing interactions. As a supervisor, having access to up-to-date metrics allows you to have better insight into your 8x8 Contact Center. You are able to better track the time spent by agents on an interaction. The duration of an agent’s interaction is reflected in the Interactions Detailed report. To learn more, see our content on access report for ongoing interactions.
Ability to report on interactions forwarded to external numbers
In 8x8 Contact Center, agents respond to inbound customer inquiries via phone and other media types. As a supervisor, you can now track whether some of these queued interactions were forwarded to an external number in the Interactions Detailed report. To learn more, see our content on interactions forwarded to external numbers.
Addition of new metrics in the Agent Status report
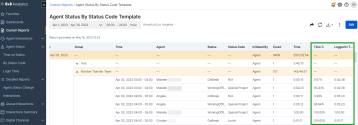
As a supervisor, you want to be able to track the amount of time an agent spent in a specific status while logged in to 8x8 Contact Center. We have introduced two new metrics in the Agent Status by Status Code report. The Time % and Logged In Time metrics will allow you to have better insight into your agent’s status.
To generate a report with these metrics:
- Go to Agent Status.
- Select By Status Code.
- Click Customize to edit the report.
- From the Metrics drop-down list, ensure Time% and Logged In Time are selected.
- Click Save to update the report.
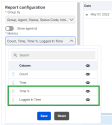
- Navigate to a date from the list, and select an interaction to view additional details.
- Scroll to the right of the report to view the new metrics.
For metric definitions, see our content on Agent Status - Time on Status glossary.
Enhancement to the Agent Status by Status Code report
We are enhancing the Agent Status by Status Code report to include reporting on all agent statuses and status codes. As a supervisor, you can filter a report by selecting all available agent metrics. To learn more, see our content on access report for agent status and status code.
Addition of Recording Filenames metric
We are introducing a new metric in the Interactions Detailed report. The Recording Filenames metric is available to supervisors for configured phone interactions. These recorded interactions are saved as WAV files. To learn more, see our content on access report for recording filenames metric.
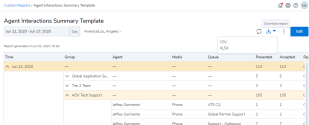
Ability to download the Interactions Detailed report as a CSV file
As a supervisor, you can download the Interactions Detailed report as a CSV file. You can choose to download a report only containing interactions, or download a report with interactions and participants.
To download the report, navigate to the menu and select Detailed Reports > Interactions > Download report. To learn more, see our content on download the Interactions Detailed report as a CSV file.
Granting agents access to analytics reports
8x8 Contact Center agents will now have access to analytics reports. Agents will only be able to view their own interactions and queues they have been assigned to. They will not have access to queue-related reports nor the Interactions Summary report. Agents will have the ability to create real-time dashboards using the Agent Activity widget. They will also have access to the following reports:
Addition of new metrics in the Interactions Detailed report
In this release, we introduced new metrics and filter options in the Interactions Detailed report. They include a metric displaying the elapsed time of an interaction, a metric displaying the number of times a customer was muted, a metric displaying the duration of an abandoned interaction, and more. To learn more about these metrics, see our content on new metrics and filter options.
Addition of new metrics in the Agent Performance widget
As a supervisor, having access to real-time metrics allows you to gain insight into your agent’s performance. You are able to closely monitor your agents, while ensuring your customer’s needs are being met. We are adding the following metrics in the Agent Performance Real-Time widget:
- Queues: This metric lists the name of the queue for each interaction.
- Channels: This metric lists the media type associated with each interaction, such as phone, chat, email or voicemail.
- Directions: This metric lists whether an interaction is incoming or outgoing.
To learn more about real-time widgets, see our content on create a dashboard using widgets.
Enhancements to Digital Channels reports in 8x8 Customer Experience
As a supervisor, you can generate reports from the Digital Channels dashboard in 8x8 Customer Experience. You can access a report for repeated interactions and view the interaction flow for transferred interactions. To learn more, see our content on enhancements to Digital Channels report.
Other features
We are adding multi-tenant support for historical and real-time metrics in the Public API. To learn more, see our developer content for Contact Center historical analytics detailed report.
In this release of 8x8 Analytics for Contact Center, we are introducing a new metric and the following enhancements:
- Ability to report on outbound SMS messages sent by an agent
- Introducing a new agent processing time metric
- Ability to report on replied customer emails
- Ability to view reports in 8x8 Customer Experience
- Increased the reporting threshold for emails in a queue
Ability to report on outbound SMS messages sent by an agent
We recently introduced a new feature in 8x8 Contact Center that allows agents to send outbound SMS messages to customers. As a supervisor, you can generate a report to track agent initiated SMS interactions with customers. The transaction details are reflected in the Interactions Detailed report. To learn more, see our content on access report for outbound sms messages.
Introducing a new agent processing time metric
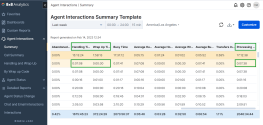
We have now introduced a new metric in the Agent Interactions Summary report. The Processing Time metric represents the sum between the time spent by an agent handling an interaction and their wrap up time.
To access this metric:
- Go to Agent Interactions.
- Select Summary.
- Select a date from the list, and click an agent’s name to view their interaction details.
- Scroll to the right of the report to view the Processing Time metric.
In this example, it shows an agent’s handling time of 7 minutes 8 seconds, and a wrap up time of 30 seconds. Hence, the agent’s processing time for the interaction is 7 minutes 38 seconds.
Ability to report on replied customer emails
In 8x8 Contact Center, agents respond to customer inquiries via email channels. As a supervisor, you can now track whether agents have responded to emails by either accessing the Interactions Detailed report or the Interactions Summary report. To learn more, see our content on access report for replied customer emails.
Ability to view reports in 8x8 Customer Experience
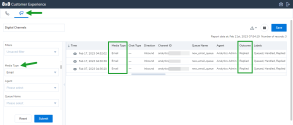
As a supervisor, you can generate similar reports from the Digital Channels dashboard in Customer Experience.
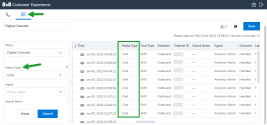
Log in to 8x8 Customer Experience. To display a report for agent email replies, select Email from the Media Type drop-down list.
Additionally, click ![]() or double-click a row in the table to open the interaction flow window. It displays the end-to-end journey of an interaction.
or double-click a row in the table to open the interaction flow window. It displays the end-to-end journey of an interaction.
To display a report for outbound SMS messages sent by agents, select Chat from the Media Type drop-down list.
To learn more, see our content for accessing digital channels report and available filters for digital channels report.
Other features
We have increased the reporting threshold for emails in a queue from 30 days to 100 days.
In this release of 8x8 Analytics for Contact Center, we are introducing the following enhancements.
Localization support in French-fr language
Beginning this release, 8x8 Analytics for Contact Center will be supported in French-fr. All the analytics for Contact Center reports, dashboards, and widgets will be available for the french users in their native language.
Ability to access the channel name in reports
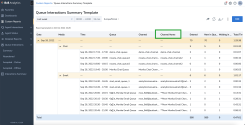
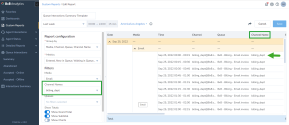
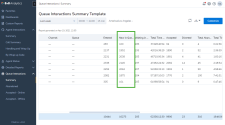
You can now access the Channel name in the Interactions Detailed report, Queue Interactions Summary report, and Interactions Summary reports. The channel name allows you to easily identify the location of an interaction. You can configure to display or hide the channel name in the report. As a supervisor, you can also filter data by specific channel names in the reports.
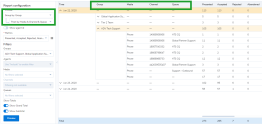
To configure a report to include the Channel Name dimension:
- Go to the Summary report, for example Queue Interactions Summary from the navigation menu.
- Click Customize to edit the report.
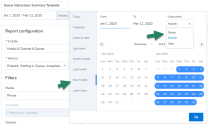
- From the Report configuration options, click the Group by dimensions, and select to view
 the Channel Name dimension.
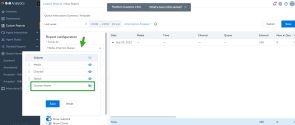
- Click Save to view the report data with Channel Name information.
- Further, let's say you wish to filter data by a specific channel name, such as by the billing department, you can simply select the desired filter in report configuration.
Updated ‘Group by’ configuration in all aggregated reports
We have updated the user interface of the “Group by” configuration for all aggregated reports, allowing arbitrary ordering of dimensions. Supervisors can choose what dimensions to aggregate data by and can easily reorder these in the report via drag & drop approach.
Alongside this arbitrary ordering of dimensions, we have updated supervising rules for the aggregated reports:
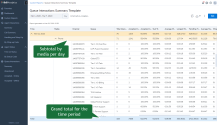
For example, in Queue Interactions Summary, if you group the data by media, then you will see only the interactions from the queues you are supervising, grouped by media.
To learn more about configuration options and updating an existing report, see our content on share and edit custom reports.
Cumulative data for agent performance and queue summary real-time widgets
The existing functionality which adds total values for agent performance or queue summaries to real-time dashboards and wallboards for count metrics has been extended to calculate and display the grand totals for average duration metrics, percentage duration metrics, and for the custom metrics as well. To learn more about displaying these real-time performance metrics on dashboards and wallboards, see our content on agent and queue performance widgets.
Other features
In addition to the above, we have introduced the following:
- A new endpoint will be available in the Real-Time API: Agents in Queue Groups, which should allow reading the agent metrics for a group of queues at once, instead of creating an API call and reading the agents' metrics for each individual queue.
- We are adding participants sub-rows for the Interactions Detailed Report in the Historical-Metrics Public API
- Unified SLA formula for aggregated values of online/offline media-types
| Old SLA% Formula | New unified SLA% Formula | |
|---|---|---|
|
Online Media Type ( Inbound/Outbound Phone, Chat) |
Accepted in SLA / (Accepted + Abandoned + Diverted + (Ongoing > SLA Threshold) - Short Abandon) |
Accepted in SLA / (Accepted + Abandoned + Dropped + Diverted + (Ongoing > SLA Threshold) - Short Abandon) |
| Offline Media type (Email, Voicemail) | Accepted in SLA / (Accepted + Dropped + Diverted + (Ongoing > SLA Threshold)) |
In this release of 8x8 Analytics for Contact Center, we are introducing a brand new report and a few enhancements:
Introducing the Interactions Summary report
Use the new Interactions Summary report for a more detailed look at the activity in your 8x8 Contact Center. The report provides an aggregated overview–a reality check– of where and how your customers are interacting with your company. This information helps you make educated decisions to improve customer service. Learn more.
These detailed views of the contact center help supervisors identify problems and address them. Let's say the metrics in the report suggest that callers are abandoning their calls while navigating through the IVR, this could indicate a complex IVR with many layers of menu options. Alternatively, if callers are waiting in a queue for long, this may signal longer handling times or shortage of agents serving the queue.
Cumulative data for agent performance and queue summary real-time widgets
In addition, this release adds total values for agent performance or queue summaries to real-time dashboards and wallboards. This new enhancement allows supervisors to:
- Access grand totals of real-time performance metrics for agents and queues to display on dashboards and wallboards.
- View real-time agent performance totals for agents such as the total duration agents have spent logged in, total number of interactions offered, accepted, rejected, and more.
- View real-time cumulative metrics for queues such as the number of agents available, number of agents currently handling interactions, working offline, on break, number of interactions which have entered queues, accepted, abandoned and more.
- From the menu, go to Dashboards.
- Click New to begin creating a new dashboard.
- Click Add Widget
 to view the widget options.
 - From the list of Real Time Widgets, select Agent Performance.
- In the add widget window, select all the necessary fields.
- Enable the toggle for Display Grand Totals.
- Click Save to view cumulative metrics such as the total duration agents have spent logged in, total number of interactions offered, accepted, rejected, and more.
- From the menu, go to Dashboards.
- Click New to begin creating a new dashboard.
- Click Add Widget
 to view the widget options.
 - From the list of Real Time Widgets, select Queue Summary.
- In the add widget window, select all the necessary values for fields.
- Enable the toggle for Display Grand Totals.
- Click Save to view cumulative metrics for queues such as the number of agents available, number of agents currently handling interactions, working offline, on break, number of interactions which have entered queues, accepted, abandoned and more.
We have introduced the following enhancements in the 8x8 Analytics for Contact Center 2.6.3 release.
Introducing cross-day time range filtering in reports
Let’s say your company needs to generate reports to assess call traffic for overnight shifts from 8 P.M. to 8 A.M. Prior to this release, you had to generate two separate reports, one from 8 P.M. to midnight, another from midnight to 8 A.M., and combine the data manually. In this release, we are introducing cross-day time range filtering in reports allowing you to generate a single report for overnight shifts. You can now generate reports for overnight shifts of specific time ranges that cross two days (i.e., from 8 P.M. to 8 A.M.). To learn more about configuring cross-day time range filtering, see our FAQ content.
Advanced filtering of data within historical widgets
Let’s say you want to compare the time spent processing chat interactions vs. voice interactions by an agent or a group. You can now use the advanced filtering within historical widgets for Agent Activity, Agent Group Activity, and Media Activity. We have introduced the ability to filter by queues, media, and agents for granular metrics within these widgets. The following table summarizes the filtering options available for each historical widget.
| Historical Widget | Filter by options |
|---|---|
| Agent Activity |
|
| Agent Group Activity |
|
| Media Activity |
|
To learn more about adding advanced filters in historical widgets, see our content on add historical widgets.
In the 2.6 release of 8x8 Analytics for Contact Center, we are introducing feature enhancements offering an improved experience.
Ability to gather aggregated data for intra-day time intervals
In the aggregated reports and historical widgets, you can now gather data for specific intra-day time intervals. Let’s say you want to gather data about agent activity during your company’s second shift from 8 am to 4 pm, you can now select the intra-day time interval and gather data for that time period. To learn more, see our content on add historical widgets.
Introducing a metric for newly queued interactions
We have now added a new metric to compute just the number of new interactions which entered a queue during the specified time interval. This helps in understanding the inflow of new interactions within a specific time or date range. This metric is different from the Entered metric. While the number of entered interactions include accepted, abandoned, diverted, and waiting in queue, the New in Queue metric includes only those interactions that have entered the queue within the specified time interval. This metric is available in the historic as well as real-time queue reports. They include only those interactions that have entered the queue in the specified time interval, excluding those that entered the queue in the previous time interval, but are waiting in the queue in the current interval.
Log into any historical or real time report for queues to access the ‘New in Queue’ metric. The new metric is available via:
- Queue-related reports
- Queue-related widgets
- Real-time & historical metrics public APIs
Example: Acme corporation has limited support on Saturdays and gets very few calls. Acme's customers know that it can take up to 10 minutes for their call to be answered. A customer calls in at 9:10 AM and an agent accepts the call at 9:17 AM. There are no other calls between 9:00 AM and 9:30 AM. The report on that day with 15 minute granularity shows the following values:
|
Time |
Entered | New in Queue |
Accepted |
|---|---|---|---|
| Apr 28, 2021 09:00 - 09:15 | 1 | 1 | 0 |
| Apr 28, 2021 09:15 - 09:30 | 1 | 0 | 1 |
Identify interactions forwarded to callback
In the Interactions Details report, you can identify those interactions which were opted for callback and resulted in a callback. Interactions which were forwarded for callback may be cancelled after a time period set in the IVR script. To learn more, see our content on interactions forwarded to callback.
Ability to share custom reports via shareable links
We have now introduced the ability to share custom reports with external parties via shareable links. Simply copy the links to downloadable reports in CSV or Excel format. Irrespective of when the report link was copied, the links when accessed will download the latest version.
To enable shareable links for custom reports:
- Go to Custom Reports from the menu.
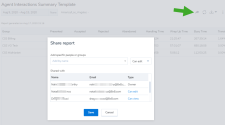
- Select a report from the list, click and select Share.
- In the Share report dialog, enable:
- Share report as CSV
- Share report as Excel
- Click
 to copy the link and share it with group members or external users who do not have access to these reports.
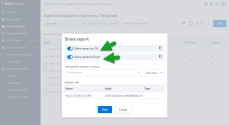
To revoke access to these reports via the links, simply disable these settings. To learn more, see our content on share custom reports.
Enhancements to dashboards
We have introduced some visual enhancements to the dashboards and wallboards:
- Ability to adjust the display font size of wallboards
- Ability to display data in a compact view
- Bold color palette for threshold visual notifications
To learn more, see our content on dashboard enhancements.
Enhanced sorting of agent names
To simplify searching of agent names in reports and widgets, we have grouped the agent names under agent groups and sorted them alphabetically. Deleted agents will be grouped under one single section: No Group.
Canadian French localization improvements
We have localized the following components in the application to French Canadian.
- Scheduled report emails are now translated into Canadian French for users with Canadian French locale selected for 8x8 Analytics for Contact Center. Beginning this release, all emails body will be translated for new or existing scheduled emails.
- The list of timezones available for reporting is now localized in Canadian French.
Limitations addressed in the current release version
| Issue | Resolution |
|---|---|
| Deleted agents removed from the default view of real-time widgets | When the option "Sync agents automatically" is toggled ON, the deleted agents will not appear anymore on the agent-related widgets (Agent Performance, Agent Resources). This behavior will be persisted no matter if the 'include logged out' toggle is on or off. |
| Extra day of data outside of the selected date range no longer affecting reports | The issue caused by incorrect handling of Daylight Savings Time is now addressed. All reports should properly display the data only from the selected date range. |
|
Agent reporting enriched with internal calls data |
Agent Interactions - Summary and Agent Status - Time on Status reports were enriched to encompass internal calls as well. All reports metrics will be incremented in case of internal calls as well. All agent reports are now consistent in terms of what scenarios are covered. |
| Limit removed from custom metrics formula |
Existing limit of max 5 operations per custom metric was increased to 50, enabling a wider and more complex range of calculations possible for a custom metric. |
| Access issues addressed: |
|
In this release, we are introducing major feature enhancements offering an improved experience.
Ability to log in to the Analytics app via the 8x8 application panel
Aa a supervisor of 8x8 Contact Center, you can now log into 8x8 Contact Center Analytics via the application panel.
- Log into https://login.8x8.com.
- Enter your log in credentials and click Login.
- From the application panel, select the 8x8 Analytics tile to launch 8x8 Analytics for Contact Center.
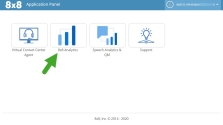
Note: The access is limited to supervisors and admins only.
Introducing the Agent Status Change detailed report
As a supervisor, do you want to understand the timeline of status changes of your agents? What time did the agent log in? When did they change their status to available? What time were they offered a call? What time did they accept or reject the call? And more. In this release, we are introducing the Agent status change detailed report which offers information about the agent status changes and actions to help answer these questions.
Let's say John logged in @ 8 am, changed his status to be available a few minutes later and was offered a call at 8:05 am which he accepted and processed. The status changes along with the time the status changes occurred is presented in this report. Additionally, the report presents info about the agent actions taken while on the call. For example, If John went on mute during the call or placed the call on hold, these actions are indicated as well on the timeline. The report offers additional details such as the status codes used, short codes, and more.
Learn more about how to access the report and how to search and filter data.
Introducing campaign data in the Interaction Details report
The Interaction Details report offers the following data about campaign interactions.
- Campaign name: Name of the campaign
- Campaign ID: The unique identifier of the campaign
- Record ID: The unique identifier for each campaign call
- Disposition action: Every attempted campaign call may be labeled with a disposition action for follow-up. The supported disposition actions are 'Try Again', 'Schedule Call Back', and 'Do not Call'.
- External transaction data: This data refers to the name value pairs that will be used for populating the transaction panel when an agent is offered the interaction.
You can search and filter the report by any of the new fields.
Note: The transaction code selected by the agent is shown in the Wrap-up code data field.
To access the campaign interactions data:
- From the menu, go to the Detailed Reports > Interactions.
-
Using the filter, select Type is Campaign. Click Search to extract only the campaign interactions.
Or
As a shortcut, click the quick access link for Campaign transaction details. Click Search to extract only the campaign interactions.

You can now view the campaign name, ID, and more.
Note: In this release, we support filtering campaign interactions tagged with the following values of disposition action:
- No code
- Do not call
- Schedule callback
- Try again
Enhancements to Dashboards & Reports
We have introduced new enhancements to improve the visualization and accessibility of data on the dashboards.
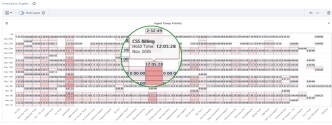
You can view data in historical widgets as heat maps. A heat map uses a system of color coding to represent values. It is useful when you have large data and you need to detect the outliers quickly. Let’s say you want to track the hold time of your agent groups and understand the groups with higher than usual hold time, simply select the Agent Group activity widget, select the desired agent groups, and choose to view metrics as a heat map. Upon saving the widget, the data is shown as a heat map with outliers in a deeper warm tone of red. Simply hover over the cell to access the agent group name, the date, and their hold time. The darker the shade, the higher the value of the metric.
Notes:
- The heat map chart can only be set up for a single metric.
- If the cell is empty, it means that there isn’t any activity on that metric. If the cell shows zero it means that the activity that did happen did not affect the metric on the chart.
- The maximum supported volume of data is 1000 entries. If your report contains more data, you will see an informative message.
We have now added two new forms of graphical charts to represent data. The dotted line chart and the area chart offer you new ways to represent data for historical widgets.
To select the new graphical charts:
- In the Dashboard, select to add a new historical widget.
- By default, the data visualization is set to the chart format.
- Next to the metrics, click
 to select the chart type.
 -
Click Save to launch the chart.
-
Additionally, you can view the grand totals of the key metrics on the legend. While editing a widget, simply enable the option to Display Grand Totals.
For all the real-time widgets, you can now visualize data through charts. The chart refreshes every five seconds. Previously, the data display was limited to tabular format.
Availability: Available for Agent Performance & Queue Summary widgets
To set up your widgets as a chart, add a new widget or start editing an existing one and select to view metrics as a chart from the drop-down list presented on the customization pop-up.
You can also download widget and reports containing graphical data in jpeg, png, pdf, and svg format in addition to the ability to download reports in CSV or excel format.
To learn more, see our content on add a queue summary widget and add an agent performance widget.
Ability to generate reports for deleted agents
While defining reports using the templates, in the drop-down list of agents, you can now spot the deleted agents quickly as they are marked as deleted. Let’s say you want to track the agent performance of active agents, you can exclude deleted agents rather quickly. Deleted agent data will also be visible for Today’s metrics on dashboards, if the agent has data from today prior to their deletion. This capability is available via our public APIs as well.
Note: Deleted agents will be grouped under one single section labeled as No Group.
Introducing new date ranges for Historical Widgets
We have introduced new date ranges for historical widgets offering more options for custom and pre-determined dated ranges. Now, you can set up any date range for all historical widgets and the historical reports.
Enhanced scope of the Agent Interactions by Wrap up Code report
We have extended the scope of the Agent Interactions by Wrap up Code report to include:
- Interactions in which the agent has been in the Available state during the interaction handling. For example, Direct agent calls in which the agent is not in a Busy state will be incremented for handling time.
- Interactions with no wrap up code selected by the agent
Introducing a new label in the Interaction Details report
Some interactions may not have a known outcome due to the existing technical limitations in our system. The Interaction Details report will now label these interactions with an unknown outcome and will identify the action taken as unknown. See glossary.
We have extended the scope of all aggregated reports to include interactions with an unknown outcome. An interaction is labeled as having an unknown outcome when the outcome is unclear during the interaction’s lifetime. This can happen due to some existing technical limitations. If you encounter this scenario in your reports, please contact 8x8 Support.
In the 2.4 release of 8x8 Analytics for Contact Center, we are introducing major feature enhancements offering an improved experience.
Announcing the end-of-life of 8x8 Business Intelligence
With feature parity nearly complete in the 8x8 Analytics for Contact Center, we are announcing the end-of-life of the 8x8 Business Intelligence application. Also referred to as Virtual Contact Center Analytics application, this analytics tool is now being replaced by 8x8 Analytics for Contact Center in the United States, United Kingdom, and Australia.
Note: Users in Canada will continue to use the 8x8 Business Intelligence application for some more time.
Introducing visual charts in historical reports
To consume data faster and better and to get a quick overview of the trends for a specific report, we are introducing visual charts to represent data in historical reports. Customize the historical reports to enable visual charts. Take a quick look at the data charts and quickly gather the key performance indicators. You do not need to dig through the numbers any more!
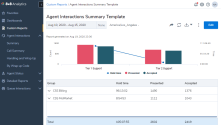
Let’s say you wish to review the key metrics for your Tier 1 Support agent group, customize the agent interactions report to view the key data in the visual chart.
To set up a visual chart to appear on your historical report:
- Go to the custom report or template report that you want to customize.
- Select the date range, dimensions & metrics for your report.
- Enable Show charts.
- Click Configure and select the metrics that you want to be included in the graph.
- By default, the metrics are grouped by type for easier configuration of the chart type.
- The metrics selected in the previous configuration window appear in this list. You cannot have different metrics in the report and in the chart.
- Click Done to save the custom report. The chart now appears at the top of your report.
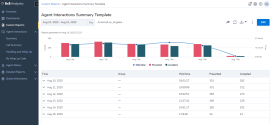
Let’s say you wish to review and compare the performance of your tier 1 and tier 2 support groups, simply set the filter to the desired groups and set the granularity to None.
Note: The charts cannot be exported or included in the scheduled reports currently.
Note: If you disable subtotal data, the visual charts will be disabled as well.
Ability to share custom reports
You can now share custom reports you create with your coworkers. Let’s say you want to share a custom report with your fellow supervisor, simply share the report with one of the two levels of access permissions: Ability to view or Ability to edit.
- View: The user can see the report configuration that the owner does, can copy and can schedule the report but cannot delete or edit the report configuration.
- Edit: The user can view, edit, schedule and delete the report. All changes made by the user who received the report with edit permission will be visible to everyone with whom the report has been shared.
Note: Only the report configuration is being shared, not the access to the data. Let’s say John shares a custom report with Robin. John supervises tier 1 and tier 2 groups, while Robin supervises Tier 1 group only. When Robin logs in, she can see the shared report under Custom reports. She can only see the data for the Tier 1 group that she supervises and not the data for Tier 2.
To share a report, click ![]() in the header, to access the sharing options.
in the header, to access the sharing options.
If Robin edits this custom report, all users who have access to the report will see the changes Robin made.
Robin can clone and edit the report without impacting the original report owned by John.
Revoking shared report
The access to the shared report can be revoked at any time by the owner. Removing the view and edit permissions will also discontinue all emails scheduled for this report by the user whose permissions are being revoked.
Introducing new report metrics
In this release, we are introducing the following new metrics.
| Historical Report | New Metrics |
|---|---|
| Agent Interactions Summary |
Avg Hold Time Transfers Initiated% |
|
Agent Call Summary |
Avg Hold Time Queue Interactions summary Accepted% Total Abandoned% Total Time to Abandon (includes Short Abandon) Longest Abandon Time Average Abandon Time Total Time Waiting in Queue Queue Interactions Abandoned Total Time to Abandon (includes Short Abandon) Total Time Waiting in Queue |
| Real-Time Widget | New Metrics |
| Agent performance widget (RT) |
Transfers Initiated (15m, 30m, Today) Transfers Initiated % (15m, 30m, Today) |
| Single Agent Stat widget (RT) |
Avg Time on Hold (15m, 30m, Today) Transfers Initiated (15m, 30m, Today) Transfers Initiated % (15m, 30m, Today) |
| Real-Time Widget | New Metrics |
|---|---|
| Agent performance widget (RT) |
Transfers Initiated (15m, 30m, Today) Transfers Initiated % (15m, 30m, Today) |
| Single Agent Stat widget (RT) |
Avg Time on Hold (15m, 30m, Today) Transfers Initiated (15m, 30m, Today) Transfers Initiated % (15m, 30m, Today) |
Extended scope of interactions in agent related reports and real-time widgets
In the agent related reports and real-time widgets, we have now included data for those interactions in which the agent has been in the available status during the interaction handling.
Let’s consider a direct agent call in which the agent status continues to be non-busy. You can now get call interaction data for this specific agent interaction. The reports include all interaction data now—of the outbound calls which are not queued, internal calls, direct agent calls in non-busy status etc.
Enhancements to the Interaction Details report
We have introduced many enhancements to the Interaction Details report. The enhancements allow you to:
Access campaign metrics
Campaign interactions data are added to the Interaction Details report. You can view the key metrics for all campaign interactions. In the Interaction type column, campaign interactions are indicated.
Track interaction of renamed entities (agent or queue)
Let’s say a queue has been renamed, you can now track interactions directed to the renamed queue. The new name appears as primary with the old name in parentheses. The following renamed entities are indicated as renamed in the reports:
Queue Name, Participant, Outbound Phone Code List, Outbound Phone Code, Outbound Phone Short Code, Outbound Phone Code Text, Wrap Up Code List, Wrap Up Code, Wrap Up Short Code and Wrap Up Code Text
Filter interactions with agent notes
Do you wish to track only those interactions where agents have added notes? Wish to review the agent notes? You can now search and filter interactions with agent notes. When you hover over, you can view most of the agent notes. To see the agent notes in entirety, simply download the report. The character limit is set to 9000 characters.
Sort and locate data quickly
Sort the column alphabetically or numerically based on the data type of the column. Let’s say you want to locate a queue name quickly, simply click the column header to sort the queue name alphabetically. You can now locate the queue name quickly.
Search and navigate to the report columns
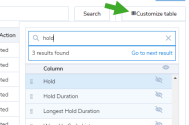
In the Customize table to select columns to view or hide in the report, you can now quickly search for a column name. Let’s say you want to look for all metrics related to a call hold, just enter ‘hold’ and all the metrics related to hold appear in the search results.
In the 2.3 release of 8x8 Analytics for Contact Center, we are introducing major new features and enhancements to offer you historical data and detailed reports for interactions.
- Introducing the Interaction Details report
- Introducing the historical widgets for dashboards
- Introducing the Agent Status - Login time report
- Aggregating agent interaction metrics by agent group
- Introducing the Contact Center Overview Dashboard
- Ability to download reports in Excel
Note: In this release, we changed the format of metrics in the CSV documents from hhmmss to milliseconds. Based on your feedback, we will be reverting this change to the previous format (hhmmss) this week. Thank you for sharing your feedback and we apologize for any inconvenience we may have caused you.
Introducing the Interaction Details report
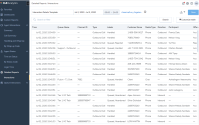
Get access to key metrics during the entire journey of an interaction. What queue was the call directed to? Who is the agent who handled the interaction? Was the call placed on hold? What was the duration of the hold? Was it transferred to another agent? What was the call outcome? Answer all these questions and many more using the data in the Interaction Details report. Select from a total of 56 metrics, arrange them to suit your needs, and even freeze those metrics that are key to the report data.
To access the Detailed Interactions report, from the menu, select Detailed Reports > Interactions.
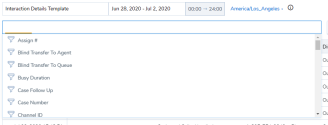
Further, you can filter data based on queues, channel ID, hold duration, and more. Do you want to track only interaction details of a specific queue? Filter further to review interactions with a hold duration longer than 30 seconds, look at only inbound calls, interactions transferred blind, and more.
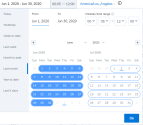
You can select any of the following date ranges available for the Detailed Interactions report:
Today, Yesterday, Week to date, Last week, Month to date, Last month, Year to date, and Last X days.
You can also select an intraday time range which allows you to track activity within a work shift such as the early morning shift from 5 am to 12 pm.
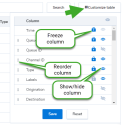
You can customize the report data by showing relevant data, reordering the columns, and freezing columns. Click Customize Table to set the following preferences:
-
 Show / hide Columns: To view only the data relevant to your business, add additional columns to the report and hide columns that are not important. Select the columns you want to include on screen and in the downloaded or scheduled report.
 -
 Reorder columns: You can reorder the columns to fit your needs by dragging and dropping columns in the preferred order.
 -
 Freeze columns: Use the lock icon to mark the columns that you want to freeze on the screen while navigating across the report.
 Note: The Time column is frozen by default in the first position and cannot be changed.
Labels allow you to indicate significant events during an interaction journey. For example, ‘Rejected’ is a label that indicates that an interaction is rejected. Let’s say you wish to track interactions that were rejected and later abandoned. In the filter, add separate labels for Labels is Rejected + Labels is Abandoned.
Let’s say you wish to review all inbound phone calls which were on hold for longer than three minutes, select the filters for media type = phone and hold duration > 3 minutes.
Further, you can filter data based on queues, channel ID, hold duration, and more. Further, you can filter data based on queues, channel ID, hold duration, and more. Apply the filters and get data that meets your business needs.
Check out the Interaction Details glossary.
Introducing the historical widgets for dashboards
In this release, we are introducing historical widgets for all dashboards. Access the historical data about queue activity or agent activity or media activity for yesterday, last 7 days, last 30 days or select a date range. Whether you are tracking weekly activity of queues or performance of agents, customize your dashboard with historical widgets and real-time widgets to track the metrics that matter to you.
With historical data widgets:
- Access visual charts or tabular data of the selected metrics for queues, media types, agents or agent groups.
- Get refreshed data every hour with updated metrics.
- Filter data for specific queues, agent groups, and media types.
8x8 Analytics for Contact Center offers four historical widgets:
As a supervisor, let’s say you want to understand how the number of interactions entered are linked to the handling time in a queue. Has there been a spike in the number of interactions and the waiting time on any day this past week?
- Log into 8x8 Analytics for Contact Center.
- Go to Dashboards. Select an existing dashboard or create a new dashboard.
-
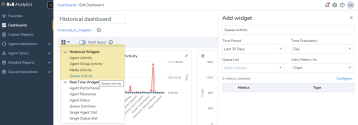
Create a new historical widget for Queue Activity.
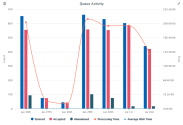
- Select the following metrics: Entered; Accepted, Abandoned, Processing time; Waiting time.
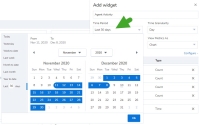
- Select the date range to be: Last 7 days.
- Select specific queues or keep the default setting to select all queues.
- Click Save to view the data chart.
When you run the widget, you can see the data chart indicating the key metrics. You can see if the average handling time spiked with the number of interactions. Was there any correlation? Did the processing time increase? By just looking at the chart, you can now see the trends.
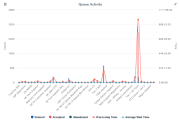
If you wish to simply track the queues with the highest wait times, set the time granularity to ‘None’ and run the report. You can now see the processing time and waiting time by queue. See which queues had a higher than average handling time? This helps in investigating further.
Let’s say you want to track the performance of an individual agent, compare their performance with other agents serving the same queue or the same group.
- Select to create an Agent Activity widget from the historical widgets.
- Select the date range to be Last 30 days.
-
Set the Time Granularity to None.
- Select individual agents or keep the default setting to select all agents.
- Select the following metrics: Presented, Accepted, Rejected, Average wrap-up time, and Average handling time.
Let’s say you want to review the performance of an agent group, compare their performance with other agent groups.
- Select to create an Agent Group Activity from the historical widgets.
- Select the date range to be Last 30 days.
-
Set the Time Granularity to None.
- Select all agent groups by default or select specific groups.
- Select the following metrics: Presented, Accepted, Rejected, Average wrap-up time, and Hold time.
- Click Save to run the report. The data chart presents all the information visually.
If you wish to see the metrics for each agent group, simply select the Data type to Table to view the numbers.
Let’s say you want to track key metrics such as average waiting time, processing time, and number of interactions by media type. What’s the average waiting time for voicemails? Which media type do we experience the longest waiting time?
- Select to create a Media Activity widget from the historical widgets.
-
Select the Time Period to be Last 30 days.
-
Set the Time Granularity to None.
Note: If you set it to ‘None’, the data will be presented by media type. If you set it to ‘Day’ or ‘Week’, the data will be presented by day or week.
- Select the metrics you wish. (Entered, Accepted, Abandoned, Longest waiting time)
-
Select specific media types or keep the default setting to select all media types.
- Click Save to run the report.
In this example, see how the average waiting time for voicemails is higher than phone, chat, and email media. When you switch to tabular format, you can see metric values for each media type.
Introducing the Agent status - Login Time report
To better track the availability and productivity of agents, we have now introduced a new report that offers login and logout time of each agent. What time did Rob log in this morning? What time did they log out? How many times did they log in during the day? What was their login duration? And more.
Note: If login and logout activities occurred on different days, the log out timestamp shows blank. For example, agent John logged in at 11 pm and logged out at 6 am on the next day, the timestamp for login shows as 23:00:00, while the timestamp for logout is blank.
From the menu, select Agent Status > Login Time.
Aggregating agent interactions data by agent group
In the Agent Interactions reports, you can now aggregate metrics by agent group level. Select to group the data by agent groups, and further by media type, channels, and queues. The report now aggregates data by agent group. Get this information and compare the performance of individual agent groups.
You can now customize the reports to group data by agent group as well as by agent group and agent.
-
Group by: Group:Let’s say you want to see the total number of interactions handled by an agent group this past week. The members in the group serve multiple queues across media types and channels. You can now group the data by media type, channel, and queue.
-
Group by: Group & Agent: Let’s say you wish to access agent activity aggregated by group. Let’s say an agent group Tier 2 handled a total of 400 interactions yesterday. How many of them are handled by Rob Smith or Maya Ray? The ability to aggregate metrics by agent groups is available in all the Agent Interactions reports. (Summary, Call summary, Handling and wrap-up, and By wrap-up code).
For details, check out the Agent Interactions report.
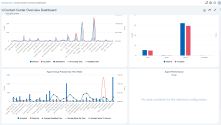
Introducing the Contact Center Overview Dashboard
Monitor your business performance with a predefined dashboard with many key widgets that will help your business needs. Whether you are tracking average waiting time of queues this past month or comparing average wrap-up time of agents, find it all in the Contact Center Overview Dashboard out of the box. We have designed the dashboard with historical and real-time widgets showing key performance indicators.
From the menu, go to Dashboards to access the Contact Center Overview dashboard,
Learn more about dashboards and how to create custom dashboards.
Ability to download reports in Excel
You can now download the reports in Excel format for better readability of the data. The report now includes a header with date range and time zone in addition to the highlighted subtotals and totals of the metrics.
This release focuses on ease of use, flexibility in customization, and easier access to 8x8 Contact Center data. We have introduced the following enhancements in the 8x8 Analytics 2.2 release:
Introducing Subtotals and Totals of metrics
8x8 introduces subtotals and grand totals of metrics in the aggregated and custom reports. Whether you are tracking agent performance or assessing queue traffic or checking how often agents change status, you can now access the sum of these key metrics by grouping similar data. As a contact center supervisor, have you noticed a spike in the average handling time of phone calls or average waiting time in queues this past week? Run the reports, get to the metrics and gain actionable insight. Get to know the performance of agents and queues for a specified time range at specific intervals of time. You no longer need to manually roll-up the data to assess issues impacting your contact center.
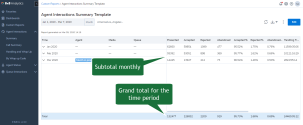
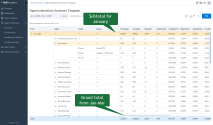
Let’s say you want to run a quarterly report to check the performance of agents. In the Agent Interactions Summary report, select the time period, and look at the total number of interactions for each month and the grand total of interactions handled during the entire quarter.
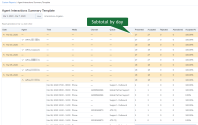
To track an individual agent’s performance, you can look at the total number of interactions handled by the agent in the specified time range and at the specified granularity. For example, To know the metrics for interactions handled by agent Jeff this week, get the grand totals for the week, drill down by day, and within the day, view the data by the specified time interval.
Let’s say you are supervising Tier 1 Support queue in your contact center and you want to check the performance of your queue this past week. You can run a report broken down by day and then by agents. Now, if you want to drill down further and extract data by media, say what was the traffic on phone queues vs chat queues, you can do it all.
Let’s say you want to review the average handling time (AHT) of phone interactions by your Tier 1 agents this past week and you notice it is higher than usual, you can drill down and look at the metrics for each day, and further identify the agents who have handled long duration calls.
You notice that the Average waiting time (AWT) is quite high this past week, view the totals by day, drill down further to understand if there was a surge in traffic causing the delay.
Selecting Date Range
While selecting a date range for your report, the granularity is set to a suitable value by default. For example, if you choose to get data for the past week, the granularity is set to 15 min by default. You can set it to hourly or up to a day. If your date range exceeds a week, you can set the granularity by week, day, hour. If your date range exceeds a month, you can set the granularity by month or year. If you choose to look at data for more than a year, view by year.
NOTES:
- When the granularity is higher than a day, the data is computed by that granularity for subtotals.
- When the granularity is smaller than a day, the subtotals will still be computed by day, then by the inclusion selected in the report, and then by the selected granularity.
- When the selected granularity is None, the subtotals will compute the selected inclusion without breaking it down by specific time periods.
Introducing new metrics
We have introduced the following new metrics in the Agent Interactions Summary report:
- Avg Speed to Answer: The average time taken by an agent to accept an interaction while being offered an interaction
- Alerting: Number of interactions that are currently being presented to the agent via a queue or outside of a queue not including direct agent calls and direct agent chats
We have introduced the following new metrics in the Agent Performance dashboard:
- Rejected Timeout: Number of interactions presented to an agent, but not accepted during the allocated time
- Alerting: Number of interactions that are currently being presented to the agent via a queue or outside of a queue
Check out the glossary for historical metrics and real-time dashboard metrics.
Introducing new APIs
New and improved APIs for real time reporting and historical reporting give you more flexibility in accessing data captured within 8x8 Analytics for Contact Center. Click here to learn more.
We have introduced the following enhancements in the 8x8 Analytics 2.1.1 release:
Ability to filter agent performance metrics by agent groups
Wish to gather performance data of agents belonging to a specific agent group such as Tier 1 in your customer support org? What’s the number of calls offered, accepted, rejected by agents belonging to a specific agent group during the last 30 mins or for the day? You can now track the overall agent metrics irrespective of queues. Simply choose the desired agent group in the Agent Performance dashboard.
- Log into 8x8 Analytics for Contact Center.
- From the navigation menu, go to Dashboards.
- In your existing dashboard, create a new agent performance widget.
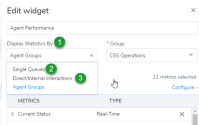
- In the widget parameters to Display statistics by, select Agent Groups.
- Select the desired agent group from the list.
- Select the desired metrics and save the widget.
The widget now displays metrics for all agents belonging to the group.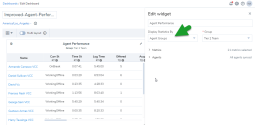
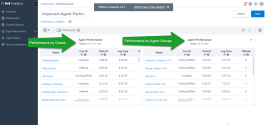
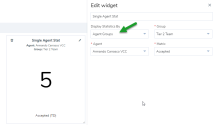
NOTE: You can filter performance metrics by agent group for single agent status widget as well.
What has changed?
We’ve renamed some user interface labels for better usability within the agent performance widget dashboard.
- Resource is now Display statistics by
- Queue is now Single Queues
- Without Queue is now Direct/Internal Interactions
We have introduced the following new features and enhancements in the 8x8 Analytics for Contact Center 2.1 release:
Ability to Extract Agent Performance Data per Queue
Do you wish to review the performance of agents on a specific queue, or track the number of interactions agents handle per queue? You can now drill down the performance data of agents for every queue they serve. Let's say Emily is serving the Tier 1 and Tier 2 queues, and you want to understand the number of interactions handled by Emily in the Tier 1 queue. How many interactions did she accept, reject, or transfer on this queue today? You can filter the data per queue.
To filter agent performance data by queue:
-
In 8x8 Analytics for Contact Center, choose to edit an existing dashboard.
- Click to add an agent performance widget.
- In the configuration screen that pops up, select the queue using the drop-down menu.
-
Click Configure to select the desired metrics.
-
From the date interval categories, select the desired category: 15 min, 30 min, Real-Time, or Today.
-
From the sub categories available, select the desired metrics.
The metrics for agent performance widget are now organized under three subcategories:
-
Agent status metrics: This subcategory offers agent status metrics, such as the time an agent has spent on different statuses for a specified time interval. How long has Emily been logged in? How long was she available, on break, working offline? View these metrics and many more.
-
Queue specific metrics: This subcategory offers metrics specific to a chosen queue, such as the number of accepted, rejected, transferred interactions by an agent in a queue. How many interactions did Emily accept in the last 30 minutes from the Tier 1 queue? How many calls did she reject? View these metrics and many more.
-
Overall metrics: This subcategory includes metrics about interactions handled outside of queues, such as internal calls (agent-to-agent calls) and direct inbound calls.
-
-
- Save the widget. The widget launches with data in the dashboard.
Usability Improvements
Prior to this release, saving a dashboard or an aggregated report continued to keep you in edit mode. The workflow has now changed. Saving your changes to a dashboard or an aggregated report now switches you to view mode. Click ![]() in the upper-right corner to switch to edit mode.
in the upper-right corner to switch to edit mode.
Ability to Retain the Granularity Settings in Reports
When you define date range granularity in reports, your settings are now retained if applicable for the date range. Let’s say that, in your agent performance aggregated report, you have chosen to get the data on a weekly basis for the past two weeks. If you change the date range to get data for the past four weeks instead, the weekly granularity setting is retained. This offers an improved experience. Prior to this release, when you modified a date range in an existing report, the granularity was reset to None.
Usability Improvements in the Wallboard Display
We have now introduced some visual improvements in the dashboard display on a wallboard. It is now optimized for viewing.
- User-friendly display colors: We have introduced more user-friendly color schemes for display.
- Effective use of screen real estate: Column width in the data tables automatically adjusts to the minimum width without hiding or truncating any data. To ensure the best use of the on-screen real estate and to better fit data from multiple widgets, the spacing between the widgets is now minimized.
- Time zone placement: The time zone is now moved to the upper-right corner and displayed in the clock setting format hh:mm.
We have introduced the following exciting new features and enhancements in the 8x8 Analytics 2.0 release:
- Introducing historical reporting for agents and queue interactions
- Ability to schedule and share custom reports
- Ability to export historical reports in CSV format
Introducing Historical Reports
We are introducing an entire suite of historical reports in the 8x8 analytics 2.0 release. All these reports for agent interactions, agent status, and queue interactions provide rich historical data. Whether you want to learn about the agent performance this past week or assess the call traffic to queues including the number of calls entered, answered, abandoned, and more, simply tap these historical report templates, customize them, and make insightful business decisions with the data received.
You now have the ability to select templates from one of the following three report categories and to configure them to meet your business needs.
- Agent Interactions: Learn about the agent behavior, activities, and their performance while interacting with customers. Track the number of interactions processed by agents, time spent processing them, time spent wrapping up these interactions and more.
- Agent Status: Get to know how often the agents changed their statuse, how long they stayed in the status, and the reason they changed status via status codes.
- Queue Interactions: Provide an insight into the call traffic in queues by tracking the number of interactions which entered a queue, interactions that were answered, and the number of interactions abandoned etc.
Check out the brand new glossary for historical reports. Please note the known limitations of historical reports in this release.
Agent Interactions Reports
In addition to the Agent Interactions Summary template introduced in 1.3.3 release, we have now introduced the following new templates for agent interactions offering supervisors the ability to track agents’ performance better:
-
Agent Interactions Call Summary: Wish to get data about the number of inbound calls, outbound calls, internal calls, transfers, conferences handled by agents? The Call Summary report now provides metrics about the calls handled along with the time spent on these calls. Whether you want to know the longest hold time of an agent, or the average time processing the inbound calls, this report can offer the data you are looking for.
-
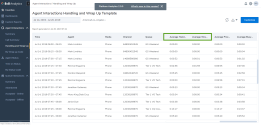
Agent Interactions Handling and Wrap up Report: Wish to access information about how well the agents are handling the interactions and how quickly they are wrapping up after terminating the call? This report offers data about the average handling time, average wrap up time for calls handled by agents in addition to the many metrics indicating agent performance.
-
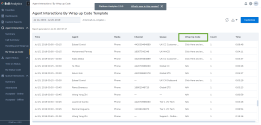
Agent Interactions Wrap up Codes Report: Wrap up codes, also known as transaction codes, indicate the outcome of every interaction. Based on the company’s business needs, you can define the transaction codes. For example, in an outbound call, wrap up codes may indicate if the call was answered by a customer, or was answered by a machine, or ended up in a wrong number. This information helps you to know how many outbound interactions were answered live.
You can customize these report templates as desired.
Agent Status Reports
To learn more about how your agents are using their time and understand the reason for their status changes, we now offer the following reports templates:
-
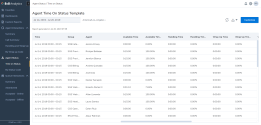
Agent Status - Time on status: Wish to take a deeper dive to learn more about how your agents are using their time? How long have they been logged in, how long were they available, what was the time spent handling interactions, time spent wrapping up, time spent on break, and more. The Time on Status report offers these details.
-
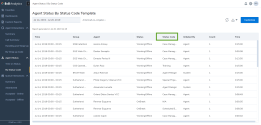
Agent Status by Status Codes: Status codes, also known as reason codes, define the reason for change of status. For example, when an agent wants to change their status from Available to Work offline, they are prompted for a reason for status change via status codes. Agents may choose to work offline for case management, or attending a team meeting or demo etc. This report provides the number of interactions with a specific status code per agent per group.
For metric definitions, refer to the Agent Status - Time on Status glossary.
Queue Interactions Reports
Track your Contact Center health by following queue specific interactions/metrics. The following report templates are available:
-
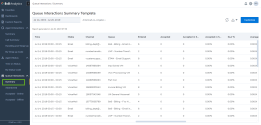
Queue Interactions Summary: Check out the number of interactions that entered a queue, number of interactions accepted by agents, rejected, diverted, abandoned by callers, and more. Also access time metrics such as average wait time for interactions, longest wait time, processing time, wrap-up time etc. for queues. If the wait time is too long for a queue, this may indicate inadequate staffing issues in the queue.
For metric definitions of the report, refer to the Queue Interactions Summary glossary.
-
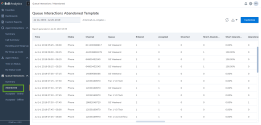
Queue Interactions Abandoned:Track the number of interactions abandoned while waiting to be served in the queue. They may be abandoned within 5 seconds of entering the queue or later. Abandoned calls may be the result of longer wait times or incorrect call routing. As a contact center supervisor, you want to track abandoned calls, understand the reason for abandonment, and take corrective measures to limit abandonment.
For metric definitions of the report, refer to the Queue Interactions Abandoned glossary
-
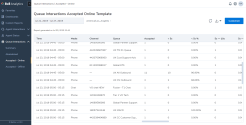
Queue Interactions Accepted - Online: Wish to know how fast agents are accepting queued phone and chat interactions? Phone and chat interactions typically warrant quick response time from agents and hence are categorized as online interactions. Access data about the number of interactions accepted by agents within 5 seconds, 5-10 seconds, 10-20 seconds, 20-30 seconds, and more, of entering the queue. This helps in tracking how quickly agents are responding to the interactions.
For metric definitions of the report, refer to the Queue Interactions Accepted Online glossary
-
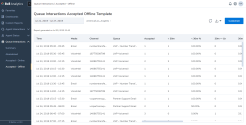
Queue Interactions Accepted - Offline: Typically, agents prioritize emails and voicemail interactions after responding to phone and chat interactions. So, the response time on these interactions are usually longer than the response time for phone calls and chats. This report offers metrics about the response time for emails and voicemail interactions accepted by agents.
For metric definitions of the report, refer to the Queue Interactions Accepted Offline glossary
You can get data in the report template with the granularity set to 15 minutes. Let’s say you want to review the agent interactions data for July 8th, you will see the data refresh every 15 minutes.
Ability to download Reports in CSV format
You can now download all these historical reports and access them at any time. Simply click the button to download the report in the CSV format. The downloaded file opens to view the data.
Every time you download a report, it saves a download notification. Pending notifications are indicated by a red dot on the bell in the upper right hand corner of the report template. Click the bell to view the notifications. If a download has failed, simply use the download button in the notification to attempt downloading the file again.
Automatic Data Synchronization
If your contact center administrator adds a new queue or an agent, the historical report will reflect data for the new entities within 15 minutes of creation if no filters are applied.
Customizing Reports
You can customize the historical report templates to meet your needs and save it for reuse. From any report template, click Customize to modify the report template as desired. Select the required report dimensions, apply the filters, preview, and save the report. You can access the saved report under Custom Reports in the navigation menu. You can edit, delete, and schedule a custom report. Let’s say you want to track the total break time taken by agents daily, you can choose the Agent Status - Time on Status report template, select the metrics to include just the break time, save it, and run the report.
Scheduling Reports
You can now schedule reports and receive them via email daily, weekly, monthly, and select from a wide range of metrics and filters to generate a report most suited to your business needs. This way, you can gain better insight into your contact center performance by focusing on the most critical data. You can choose to send scheduled reports to your colleagues or external contacts to keep them updated. To schedule a report, you must first create a report and save it. For details on scheduling a historical report, click here.
In this release, we are introducing the first aggregated historical report which offers historical data about agent activity.
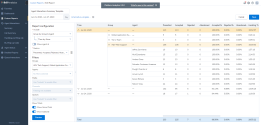
Introducing the Agent Interactions Summary Report
As a contact center supervisor , do you need to review the performance of your agents periodically? Do you want to drill down their activity history monthly, weekly, and hourly to understand and address any challenges? What’s the number of phone calls offered, accepted, rejected, abandoned by an agent? What’s the average handling time of calls this past hour? How long have the agents been busy since morning? and more. The new Agent Interactions report by 8x8 Analytics offers you historical data of agent activity which answers all these questions.
Access the report out of the box using the default template and create a custom report tailored to your business needs. This report offers insight into agent behavior and presents metrics on the time invested by the agents on specific interactions.
Benefits:
- Customize date range and granularity as well as timezones
- Select desirable metrics and dimensions
- Rearrange the display of data columns tailored to your business needs
- Select the aggregation to be done for specific dimensions
NOTE: The Agent Interactions Summary report provides you data similar to the historical VCC reports such as “Transactions”, “Transactions per media”, “transactions per channel per queue”, ”transactions per media per queue”, and “transactions per media per channel per queue”.
Accessing the Agent Interactions Summary report
- Log into VCC Analytics. You must be an administrator or a supervisor in the Virtual Contact Center to access VCC Analytics. Learn more.
- Go to Agent Interactions > Summary from the navigation menu.
- The historical activity data for the past week is displayed for all agents supervised by you.
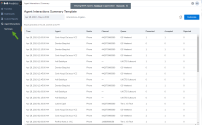
By default, the data is presented for the past week. To customize date range, time zone, or metrics, you must customize the template.Learn more about customizing the template.
To access the glossary of metrics, click here.
Enhanced User Experience During Dimension Selection
In queue summary widget and agent performance widgets, we have introduced a few improvements in selecting agents, queues, or metrics.
- Label changes: In the Queue Summary widget, the toggle option Configure queues shown manually is now relabeled as Sync queues automatically.
- In the Agent Performance widget, the toggle option Configure agents shown manually is now labeled as Sync agents automatically. The Add link is now labeled as Configure.
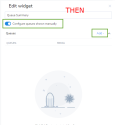
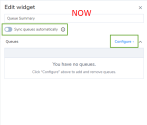
On-screen messages such as "You have no queues" guide users to take the appropriate steps. - By default, the option to sync queues or agents automatically is enabled. For queues, it selects all queues you are assigned to. For agents, it selects all agents supervised by you. Disable this setting to select the desired queues or agents manually. You can select items individually from the list or filter by keywords and select those that match the search criteria with a single click.

With a single click, your dimension selections are populated to the widget.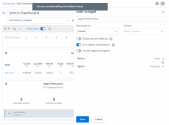
- View for lengthy queue names: In the Queue Summary widget, we have introduced hover-over tooltips that reveal the queue names in their entirety. Hover over a queue to view the queue name in entirety. It is helpful while you are selecting queues with long names that are truncated (for example: Tier_Billing_en, Tier_Billing_es).
Optimized Wallboard Display
For optimal use of real estate on the display screens of wallboards, we allow you to hide time zone and widget header information.
In the wallboard settings, toggle the options as desired.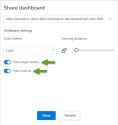
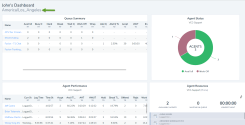
Improved Wallboard Visibility
Zebra striping is the faint shading of alternate rows of tabular data to guiding eyes along the rows. We have now applied the zebra striping format to our data tables in wallboards for enhanced readability.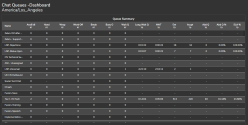
Introducing New Metrics
We have introduced the following real-time metrics in the Queue Summary widget:
- Avg Offering Time (Queue Summary widget): The average time it takes to accept an interaction from the time it is offered to the time it is accepted. This metric is applicable to queues. For example, if average offering time of a queue exceeds 10 seconds, you can investigate further by reviewing the average handling time of the queue members in the agent performance widget.
- Longest Offering Time (Queue Summary widget): The longest time it takes to accept an interaction (compared to all the interactions that entered a queue) from the time it is offered to the time it is accepted or rejected by an agent.
- Longest Offering Time (Agent Performance widget): The longest time spent by an agent before accepting or rejecting an offered interaction. (Time starts from the moment the interaction is presented to the agent to the moment the agent accepts or rejects.
Enhanced Dashboard Layout
Defining your dashboard layout to suit your screen size is now simpler and easier to improve the user experience. The basic and advanced layout menu is enhanced to a multi-layout toggle. With the enhanced layout, you can now view the dashboard layout you are editing. While resizing your browser, a message indicates that you are editing the small, medium, or large-screen layout based on the browser size.
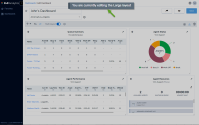
Introducing "Average Diverted Time" in Queue Summary
The average diverted time is the average time spent by all interactions that entered the queue and left without the interaction being accepted by an agent (typically forwarded to another queue, agent, or voicemail as a result of logic within an IVR script).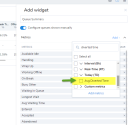
Improved Filtering in Queue Summary Widget Definition
We have introduced the following enhancements in the search filter while defining a queue summary widget:
- Improved queue selection: Select all queues with just a click.
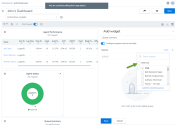
- Improved experience with finding queues: The queues are now grouped and displayed based on media type; chat, phone, or voicemail. You can find and select all queues of a specific media type quickly.
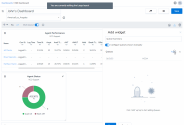
- Improved search: When you search by keywords, you see all queues that contain the search keywords.
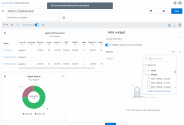
Improved Search in Agent Performance Widget
The following enhancements improve the search efficacy while defining an agent performance widget:
- Select all agents quickly with a single click, and click Add Selected Agents in the search filter.
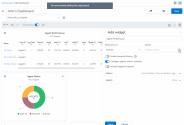
- Search for an agent by first or last name, select the desired agents from the resulting list, and click Add the selected agents.
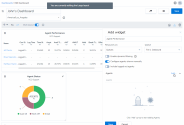
User Interface Re-Skin Changes
We have modified a few navigation icons in the application interface.
Introducing the Single Metric Widget
As a contact center manager who monitors agent performance or the call handling capability of a queue, you want to closely monitor certain key performance indicators (KPI) to ensure customer satisfaction. Whether it is the call waiting time in a queue, or the longest hold by an agent, you want to access these KPIs quickly without having to hunt for them on your data-rich dashboard. With the new single metric widget for agents or queues, you can now select an important metric and create a widget to display these critical KPIs prominently as desired. This improves the visibility of the most important metrics. Watch whether the average handling time of an agent call exceeds five minutes, or if the longest waiting time for a queue exceeds a certain time limit. These widgets draw immediate attention to the KPIs on the dashboard. Get to the numbers quickly, and take corrective actions.
Learn how to create a single-stat widget for queue and agent performance metrics.
Date Format on Timestamp Metrics
Instead of the dd/mm/yyyy format, the date format on timestamp metrics is now MMM dd, yyyy hh:mm:ss a, as in Dec 2, 2010 2:39:58 AM. Time is changed from a 24-hour format to an AM/PM format.
Enhanced Thresholds
- Ability to set thresholds for custom metrics: You can now set thresholds for custom metrics you created for queues or agents. While creating a threshold, simply select the desired custom metric, apply the visual and sound notification alerts.
- Threshold Notifications via audio alerts: In addition to the visual alerts, you can now set an audio alert. You can select from a choice of sound notification types, and control the interval at which sound alerts occur.
To learn more about defining threshold sets, click here.
New and Changed Metrics
- Introducing Additional Metrics: The following two new metrics are introduced:
- Total Interactions Handling: The total number of interactions being handled by agents. This includes all interactions from the time an agent accepts an interaction until wrap-up. This excludes interactions that are in the wrap-up state.
- Total Interactions Wrap Up: The total number of interactions currently being handled by agents in the wrap-up state.
- Renamed Metric: The metric that was previously referred to as Available is now called Available Idle, and indicates the total number of agents enabled, assigned, and in the available state (idle waiting).
- Split existing metrics: Previously we had a single metric for abandonment. To filter the short abandoned calls from this list, we have now introduced two new metrics:
- Short abandonment: Calls that were dropped by the caller before being accepted by an agent. By default, this is set to 10 seconds, and covers calls abandoned by the caller before reaching 10 seconds or before being accepted by an agent within 10 seconds.
- Abandonment: Calls that were abandoned by the caller after waiting for a specified duration greater than 10 seconds.
- Total abandonment: The total number of calls abandoned by the caller, and is counted as (Short abandoned calls + Abandoned calls).
Introducing Custom Metrics
In addition to the vast number of metrics available out of the box, you can now create custom metrics based on existing metrics to derive data specifically tailored to your needs. Simple arithmetic operations of addition, subtraction, multiplication, and division can be applied. You can configure custom metrics for queues as well as agent performance widgets. Basic validations prevent you from adding unsupported metrics. Once you define a custom metric, add it to the desired dashboard widgets.
Example 1: Let’s say you want to know the number of successful calls in your queue, those that entered the queue and were not abandoned. Simply create a custom metric by subtracting the abandoned calls from the number of calls that entered a queue.
Successful calls = Entered - Abandoned
Example 2: To determine the total number of calls handled within a queue, subtract the calls that were diverted from the queue to another queue or another phone number from the calls that entered the queue.
Total Calls Handled = Entered - Diverted
To configure custom metrics:
- In the top-right corner, click under your name and select Custom Metrics from the menu.
- From the pop-up window, select to create a custom metric for agent or queue metrics.
- Click New.
- Enter the name, display name, and the following information:
- Value Type: Indicate if the metric is of the Count, Percentile, or Time type.
- Metric Type: Select if the metric is real-time, interval-based, or for today.
- Description: Add a description of the metric.
- Formula: Add the correct formula to calculate the custom metric; use arithmetic operations (addition, subtraction, multiplication, and division).
Example: To find out the number of successful calls in a queue, select Queue Set, add other details in step 4, and enter the formula Entered - Abandoned.
Adding a Custom Metric to the Dashboard
Once you define a custom metric, you need to add it to the desired dashboards.
- Go to Dashboards. Select to edit a desired dashboard.
- To embed a queue custom metric, select to edit the Queue Summary widget.
- In the edit mode, click Add under Metrics, search for Successful Calls, or scroll down to find and select to add.
- Save your changes.

Support for Outbound Phone Queues
In this release, you can track metrics for outbound phone media type. Whether it is the number of calls handled in an outbound queue for the day, or tracking the performance or status of agents serving the outbound phone queues, 8x8 Analytics for Contact Center now provides data for outbound phone queues. While creating a widget, select an outbound phone queue to view the metrics.
Support for Chat Queues
With support for the chat media type, you can now track metrics for chat interactions handled by agents. In the Queue Summary widget, select chat queues and track the number of chat interactions waiting in the queues, number of agents available to process these chats, average handling time, and more! Find out the number of accepted and diverted chats, average handling time and more by selecting the chat queues in the dashboard widgets.
Support for Voicemail Queues
With extended support for the voicemail media type, you can now track desired metrics for voicemail queues. In a queue summary widget, select voicemail queues, and fetch the metrics for the number of voicemails accepted and handled by the agents. Choose voicemail queues to fetch the desired voicemail metrics in the dashboard widgets.
Define Thresholds to Track Agent Performance
You can now define thresholds to alert supervisors when agent performance metrics slip below a desired value. Threshold alerts can warn you about performance shortfalls and necessitate action. As a supervisor, you want to ensure agent productivity. Let’s say you want to be notified when an agent has placed a caller on hold for longer than two minutes, or when an agent takes a longer break than the scheduled break time (such as 15 minutes). Define threshold alerts for break time and hold time metrics in your dashboard, and assign them to the desired queues. On your wallboard, you see visual warnings when the values exceed the thresholds, indicating the need for further action.
You can create thresholds to track metrics for queues or agents. To learn more about adding thresholds, click here.
Dashboards in Basic Mode
Dashboards are now available in Basic mode and Advanced mode.
- The Basic mode allows users to create one optimal viewing resolution that works for all monitors. You do not need to create an individual dashboard layout for each screen size.
- The Advanced mode gives you the flexibility to define the layout and size of the dashboard to suit the varying screen size. Whether it is your computer screen, a monitor screen, or a big TV, customize the layout of your widgets to suit the screen size for best viewing.
To select the basic mode, select to edit a dashboard. Click the drop-down button next to Basic. Select Basic or Advanced mode.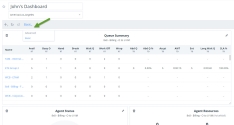
Default Time Zone for Dashboards
While creating a new dashboard, the tenant time zone that was set up in 8x8 Admin Console is applied by default. You can apply the desired time zone by selecting it from the drop-down list.