Access the Agent Interactions Summary report
As a contact center supervisor, do you need to review the performance of your agents periodically? Do you want to drill down their activity history monthly, weekly, and hourly to understand and address any challenges? What’s the number of phone calls offered, accepted, rejected, abandoned by an agent? What’s the average handling time of calls this past hour? How long have the agents been busy since morning? and more. The Agent Interactions report by 8x8 Analytics for Contact Center offers you historical data of agent activity which answers all these questions.
Benefits
- Customize date range and granularity as well as timezones
- Select desirable metrics and dimensions
- Rearrange the display of data columns tailored to your business needs
- Select the aggregation to be done for specific dimensions
To access the Agent Interactions reports:
- Log into 8x8 Analytics for Contact Center. You must be an administrator or a supervisor in the Virtual Contact Center to access these metrics. Learn more.
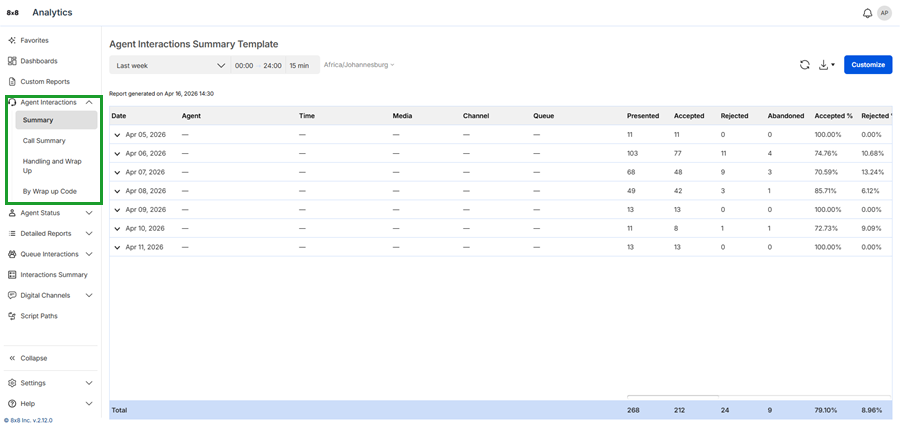
- Go to Agent Interactions from the navigation menu. Select the desired report template under the category.
- The historical activity data for the past week is displayed for all agents supervised by you.
By default, the data is presented for the past week. To customize date range, time zone, or metrics, you must customize the template. Learn more about customizing the template.
To access the glossary of metrics, click here.
Report templates
8x8 offers four default report templates to track agent interactions. Access the report out of the box using the default template and create a custom report tailored to your business needs. This report offers insight into agent behavior and presents metrics on the time invested by the agents on specific interactions.
-
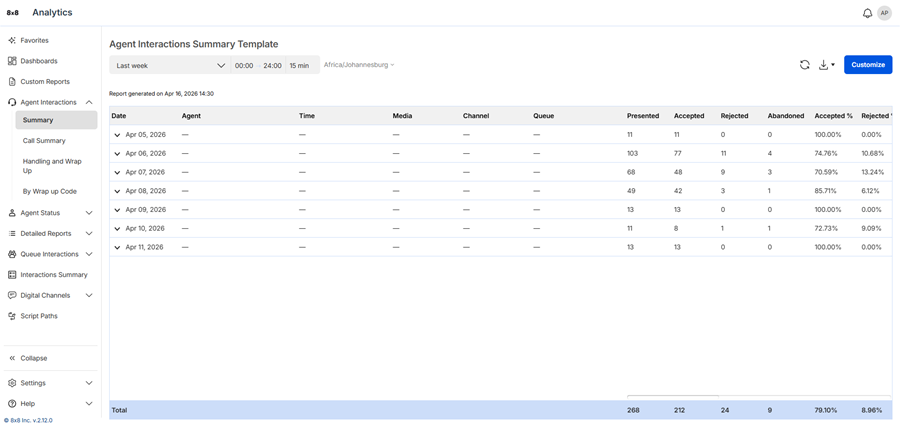
Agent Interactions Summary:: Drill down the metrics to understand the agent performance by reviewing the number of phone calls offered, accepted, rejected by agents.

For metric definitions of the report, refer to the Agent Interactions Summary glossary.
Note: The Agent Interactions Summary report provides you data similar to the historical VCC reports such as “Transactions”, “Transactions per media”, “transactions per channel per queue”, ”transactions per media per queue”, and “transactions per media per channel per queue”.
-
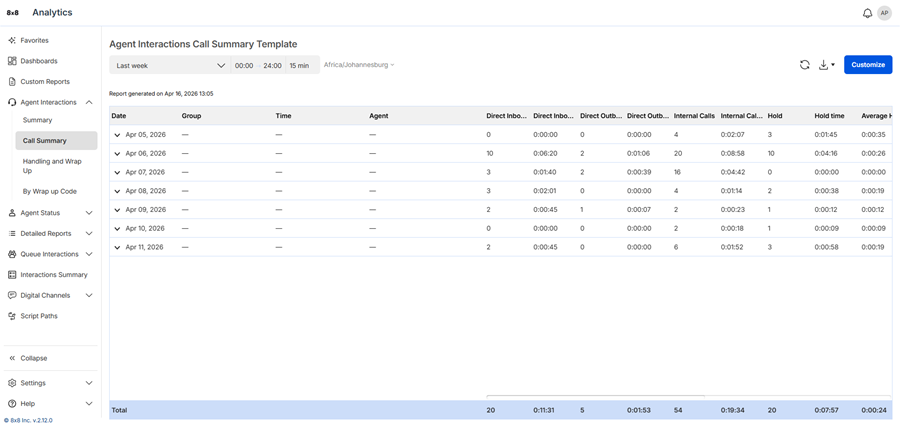
Agent Interactions Call Summary: Do you want to view data on the number of inbound, outbound, and internal calls, as well as transfers and conferences handled by agents? The Call Summary report provides metrics on calls handled by agents, including the time spent on each call. You can use this report to identify metrics such as the longest hold time or the average handling time for inbound calls.
Note: The report doesn't include all inbound and outbound calls. It includes external inbound calls routed directly to agents and outbound calls initiated by agents without using a queue.
For more information on these metrics, refer to the Agent Interactions Call Summary glossary. -
Agent Interactions Handling and Wrap up Report: Wish to access information about how well the agents are handling the interactions and how quickly they are wrapping up after terminating the call? This report offers data about the average handling time, average wrap up time for calls handled by agents in addition to the many metrics indicating agent performance.
For metric definitions of the report, refer to the Agent Interactions Handling and Wrap up glossary.
-
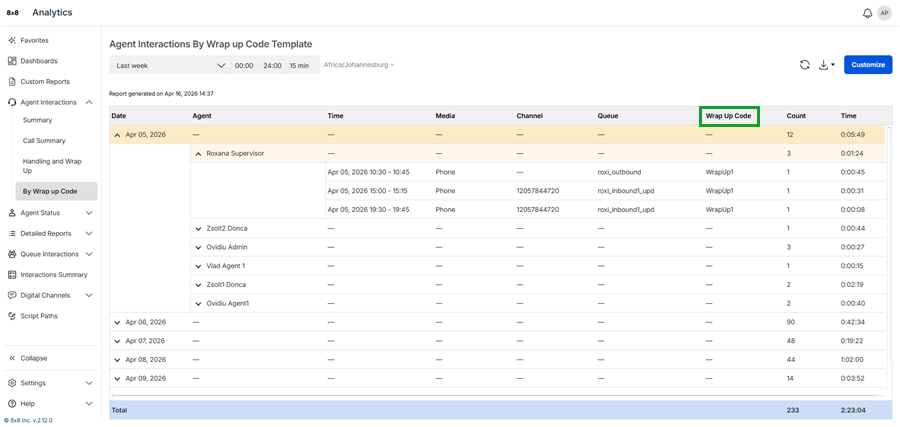
Agent Interactions Wrap up Codes Report: Wrap up codes also known as transaction codes indicate the outcome of every interaction. Based on the company’s business needs, you can define the transaction codes. For example, in an outbound call, wrap up codes may indicate if the call was answered by a customer, or was answered by a machine, or ended up in a wrong number. This information helps you to know how many outbound interactions were answered live.
For metric definitions of the report, refer to the Agent Interactions Wrap up codes glossary.
The Agent Interactions by Wrap up Codes report includes:
- Interactions in which the agent has been in the Available state during the interaction handling. For example, Direct agent calls which do not place an agent in a Busy state will be incremented for handling time.
- Interactions with no wrap up code selected by the agent

Customizing the Agent Interactions Report Template
To tailor the Agent Interactions Summary report to suit your business needs, you must customize the default template and save it. Once saved, it shows up as a custom report.
- Click Customize in the default template.
- Select the time zone from the drop-down menu.
- Click the Date range and select from the readily available choices such as yesterday, last week, last month, etc. Based on the date range, you can choose an appropriate granularity (15 min, 30 minutes, hour, day). Select intra-day time intervals such as 06:00 to 14:00 to extract data for a specific work shift.
-
Select the following dimensions and save your settings.
-
Metrics: Select from the available metrics.
-
Agents: Select all or select desired agents individually. Rearrange metrics as desired; as well as reset to the default order.
-
Media: Do you want to filter data by media? Say you want to review the phone call history handled by an agent, select Phone media. If Robin serves phone interactions most of his work day and addresses chat traffic during late evenings, you can access the call and chat activity by filtering on media type.
-
Queue: Wish to access data for specific queues? If Robin serves customer support tier 1 queue but handles tier 2 traffic occasionally, you can track John’s activity on both queues or select the desired queue
-
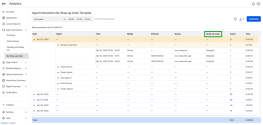
Report layout: The report layout allows you to display data based on specific dimensions. Do you want to view agent interactions based on media type, queues, and channels? Select the desired report layout for an insight into the metrics.
- Agent: I want to see the total number of interactions handled by agents yesterday. This includes all media, queues, and channels. Robin accepted a total of 400 interactions yesterday.
- Group: Let’s say you want to see the total number of interactions handled by an agent group this past week. The members in the group serve multiple queues across media types and channels. You can now group the data by media type, channel, and queue.
-
Group & Agent: Let’s say you wish to access agent activity aggregated by group. If the agent group Tier 2 handled a total of 400 interactions yesterday, how many of them are handled by Rob Smith or Maya Ray?
-
Agent & Media: I want to access agent activity aggregated by media type. Let’s say Robin handled a total of 400 interactions yesterday. How many of them are phone, chat, and voicemail interactions? You can filter further to include only phone and voicemails, but not chat.
-
Agent & Media & Queue: I want to view agent activity data based on media and queues. Example: I want to access metrics of the phone and chat activity handled by agents serving customer support tier1 and tier2 queues this past week.
-
Agent & Media & Channel: I want to view agent activity on toll-free phone channels <1-8xx-23xx> <1-877-2xx4> dedicated to serving tier 1 customers.
- Agent & Media & Channel & Queue: I want to view agent activity via chat dedicated to billing inquiries in New York and San Francisco. Further, I want to drill down to look at data for new customer queues.
-
Group & Media: I want to access agent group activity aggregated by media type. Let’s say Agent Group 1 handled a total of 400 interactions yesterday. How many of them are phone, chat, and voicemail interactions? You can filter further to include only phone and voicemails, but not chat.
-
Group & Media & Queue: I want to view agent group activity data based on media and queues. Example: I want to access metrics of the phone and chat activity handled by a group serving customer support tier1 and tier2 queues this past week.
-
Group & Agent & Media & Channel: I want to view agent group and each agent’s activity on toll-free phone channels <1-8xx-23xx> <1-877-2xx4> dedicated to serving tier 1 customers.
-
Group & Agent & Media & Channel & Queue: I want to view agent group and each agent’s activity via chat dedicated to billing inquiries in New York and San Francisco. Further, I want to drill down to look at data for new customer queues.
-
Group & Agent & Media: I want to access agent group and each agent’s activity aggregated by media type. Let’s say Agent John from Agent Group 1 handled a total of 400 interactions yesterday. How many of them are phone, chat, and voicemail interactions? You can filter further to include only phone and voicemails, but not chat.
-
Group & Agent & Media & Queue: I want to view agent group and each agent’s activity data based on media and queues. Example: I want to access metrics of the phone and chat activity handled by a group by a specific agent serving customer support tier1 and tier2 queues this past week.
-
Group & Agent & Media & Channel: I want to view agent group and each agent’s activity on toll-free phone channels <1-8xx-23xx> <1-877-2xx4> dedicated to serving tier 1 customers.
-
Group & Agent & Media & Channel & Queue: I want to view agent group and each agent’s activity via chat dedicated to billing inquiries in New York and San Francisco. Further, I want to drill down to look at data for new customer queues.
-
-
After customizing the report, save it to access it under Custom reports.