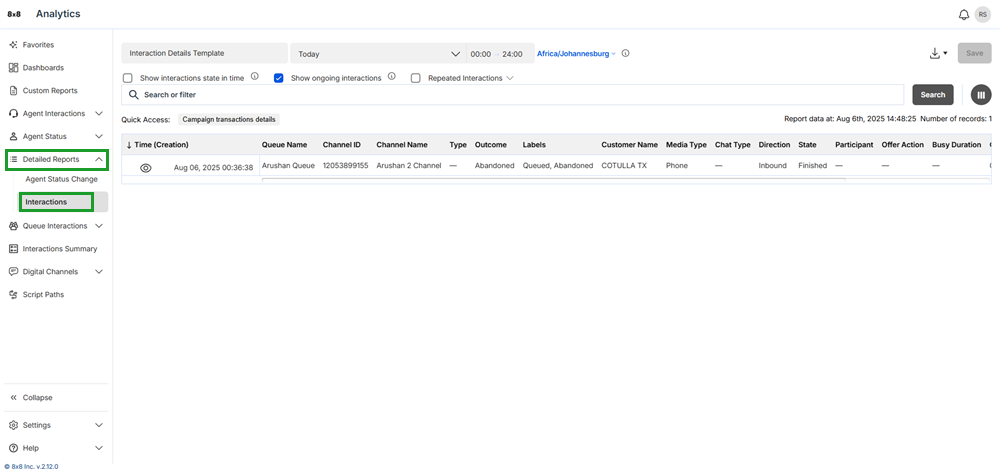
Access the Interaction Details report
Use the Interaction Details report to gather comprehensive data about individual interactions. You can find out:
- What queue the interaction was directed to.
- Which agent handled the interaction.
- Whether the call was placed on hold, and for how long.
- Whether the interaction was transferred to another agent.
- Whether the interaction was elevated to video.
- The final interaction outcome.
Choose from more than 50 available metrics, organize them based on your needs, and lock key metric columns into place to keep them visible as you scroll through the report data.
To access the Interaction Details report, go to Detailed Reports > Interactions from the menu.
Do you want to track only the interaction details of a specific queue? Filter further to review interactions with a hold duration longer than 30 seconds, look at only inbound calls, blind transfers, and more. You can filter data based on queues, channel ID, hold duration, and more. For more information, see our glossary of terms for detailed interactions.
Filter the Interaction Details report
Use compound filters to refine your reports and gain actionable insights. These filters help you:
- Focus on specific outcomes or segments in your dataset.
- Track performance metrics more precisely.
- Make informed, data-driven decisions to improve efficiency.
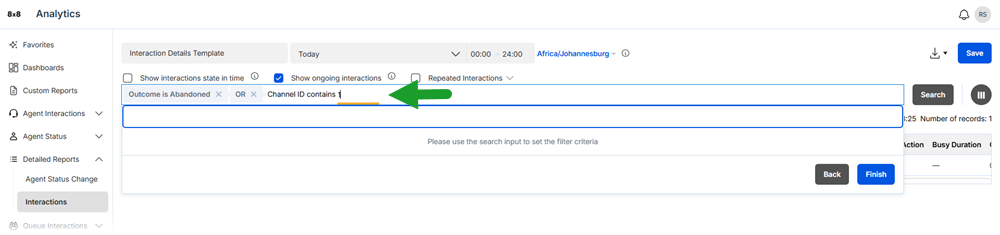
For example, to report on interactions that were elevated to video, apply the compound filter <Labels is Video SMS Sent> . This ensures your report reflects only the most relevant interactions.
Note: Some interactions may not have a known outcome. The Interaction Details report will label these interactions as an Unknown Outcome. See our glossary of terms for detailed interactions.
To apply a compound filter:
- From the menu, go to Detailed Reports > Interactions.
- Choose a date range and the location for your report.
- Click the filter bar and select Chat Type from the filter list.
- From the list, select a comparison operator such as is, isn’t, contains, =, etc.
- Select a filter criterion from the list or type a value where required.
- Click Finish.
- Click Search.
- (Optional) Click Save to create a custom report. This lets you run this report in the future without re-entering your filter settings.
Note: You can apply more than one compound filter to refine your search.
.
Customize the Interaction Details report
You can customize the report data by showing relevant data, reordering the columns, and freezing columns.
To customize a report:
- From the menu, go to Detailed Reports > Interactions.
- Click the Customize table
 icon from the right-hand side of the search bar to edit the report metrics.
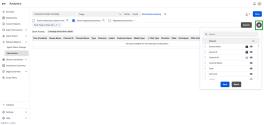
- Locate the relevant metrics from the list and use the following options next to the metrics to customize the report:
 Show/Hide columns: Choose which metrics to include on-screen and in the downloaded or scheduled report. click next to the metric to view the metric in the report. Click
  to hide the metrics that are not important.
 Lock columns: Click the lock
  icon next to the metric you want to keep in the same position on the screen while navigating across the report. The lock icon only displays at the beginning of the metrics list. Once you lock a metric, the option to lock the next metric becomes available. You can rearrange metrics to suit your organizational needs.
 Reorder columns: Rearrange the columns by dragging and dropping columns in the preferred order.
- Click Save.

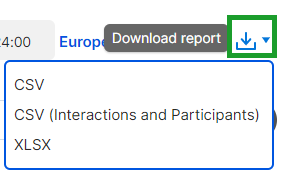
Download the Interactions Detailed report as a CSV file
You can download the Interactions Detailed report as a CSV file. You can choose to download a report only containing interactions, or download a report with interactions and participants.
To download the report:
- From the menu, go to Detailed Reports.
- Select Interactions from the list.
- Select Download report and click CSV.
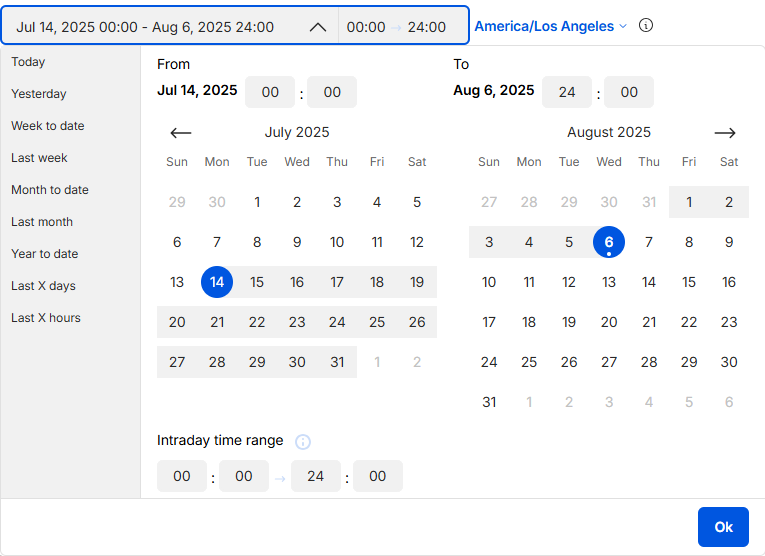
Date and time range selection
You can select any of the following preset date ranges available for the Interactions Detailed report or select a custom date range:
Today, Yesterday, Week to date, Last week, Month to date, Last month, Year to date, and Last X days.
You can also select an intraday time range which allows you to track activity within a work shift such as the early morning shift from 5 am to 12 pm.
Show/Hide, reorder, and lock columns
You can customize the report data by showing relevant data, reordering the columns, and locking columns to a specific position. Click Customize Table to set the following preferences:
-
Show/Hide columns: Choose which metrics to include on-screen and in the downloaded or scheduled report. click next to the metric to view the metric in the report. Click to hide the metrics that are not important.
-
Lock columns: Click the lock icon next to the metric you want to keep in the same position on the screen while navigating across the report. The lock icon only displays at the beginning of the metrics list. Once you lock a metric, the option to lock the next metric becomes available. You can rearrange metrics to suit your organizational needs.
-
Reorder columns: Rearrange the columns by dragging and dropping columns in the preferred order.
Note: The Time column is fixed in the first position by default and cannot be moved.
Access recordings for customer interactions
You can access customer recordings in the Interactions Detailed Report. These recordings are linked from the 8x8 Quality Management and Speech Analytics (QM&SA) application.
To access customer recordings:
- From the menu, go to Detailed Reports.
- Select Interactions from the list.
- Select a date range from the drop-down list.
- Click Search to generate the Interactions Detailed report.
- Click
 for the interaction whose recording you would like to access.
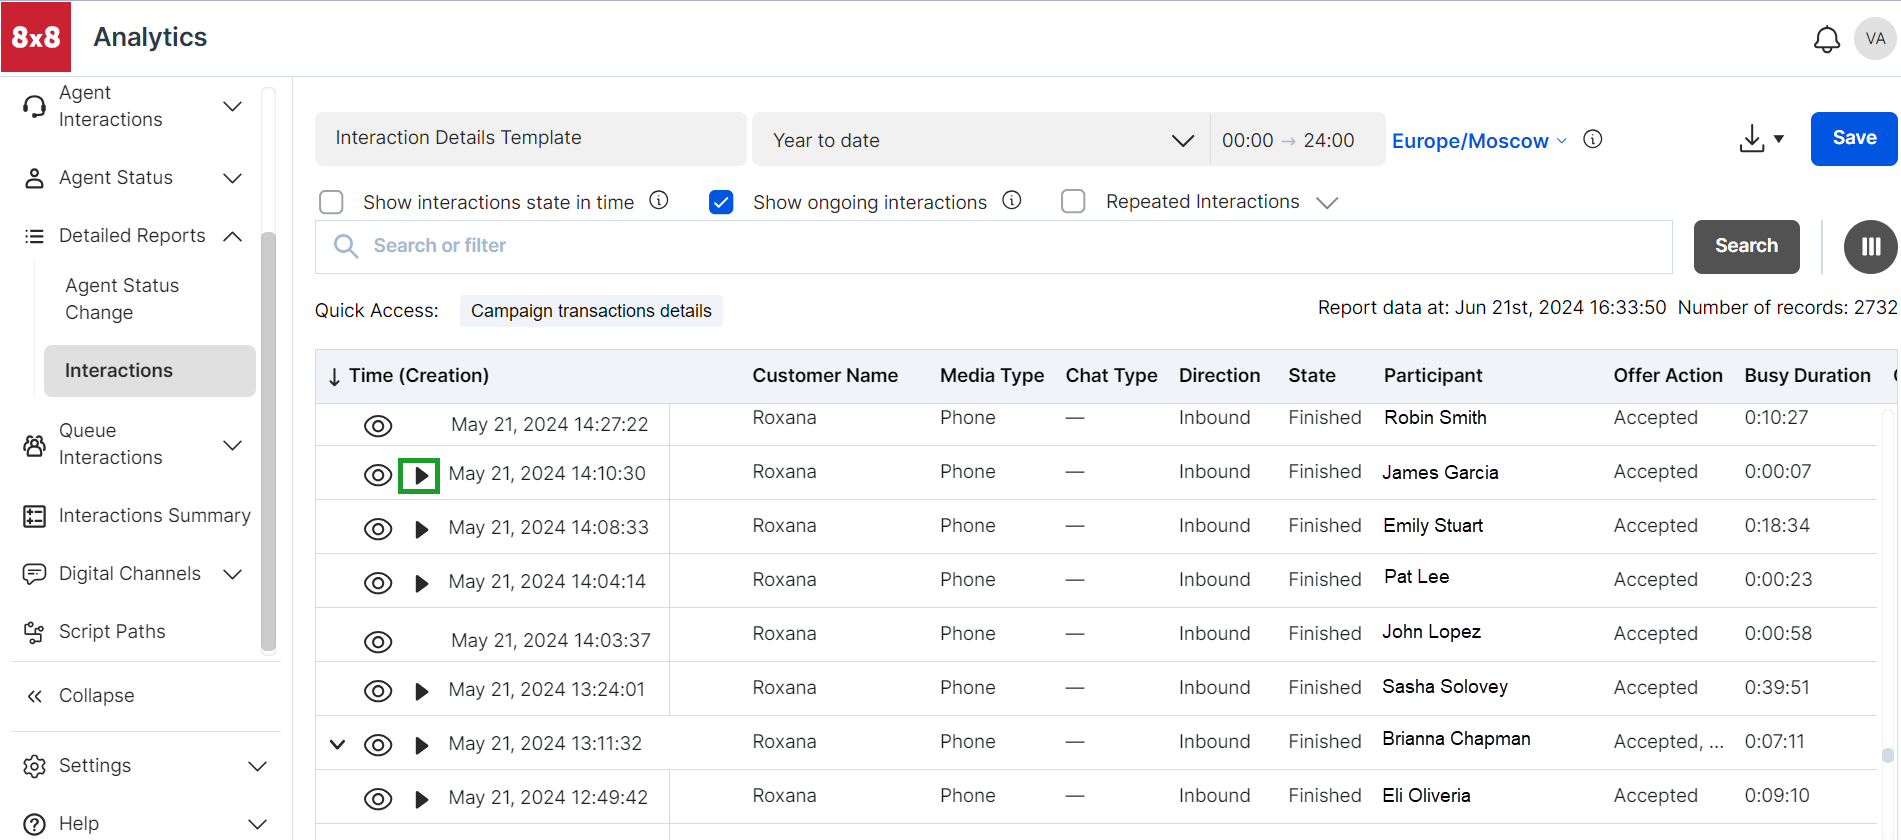
The interaction details is displayed in the QM/SA application, along with a recording of the interaction.

To learn more about the interaction details, see 8x8 Quality Management and Speech Analytics tools.