About 8x8 Contact Center Dashboards
The highly-visual and intuitive dashboards give you instant understanding of your contact center performance. Powerful tools show you what is going well, and where you need to focus resources to improve your customer experience. Create data charts tailored to your business needs using custom widgets, and track the effectiveness of your queues or agents. You can use the predefined dashboard, which has predefined widgets or create your own dashboard from scratch.
Features
- Access a summary of your queue activity, including how many interactions a queue has accepted, rejected, finished, and more.
- View agent performance within a queue, including information on the total and average metrics of the agent's communications.
- Keep track of the status of all agents within a queue, and see how many agents are available, on break, working offline, and more.
- Monitor real-time information on agents, including their status and information on their current call.
- Select intra-day time interval to access key metrics for selected time range
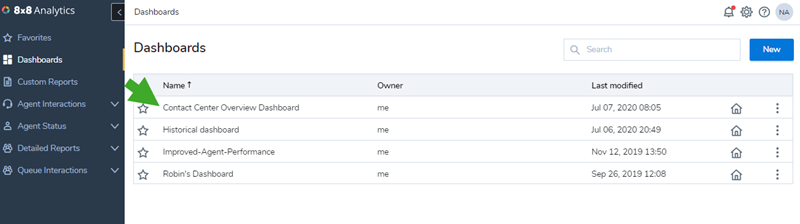
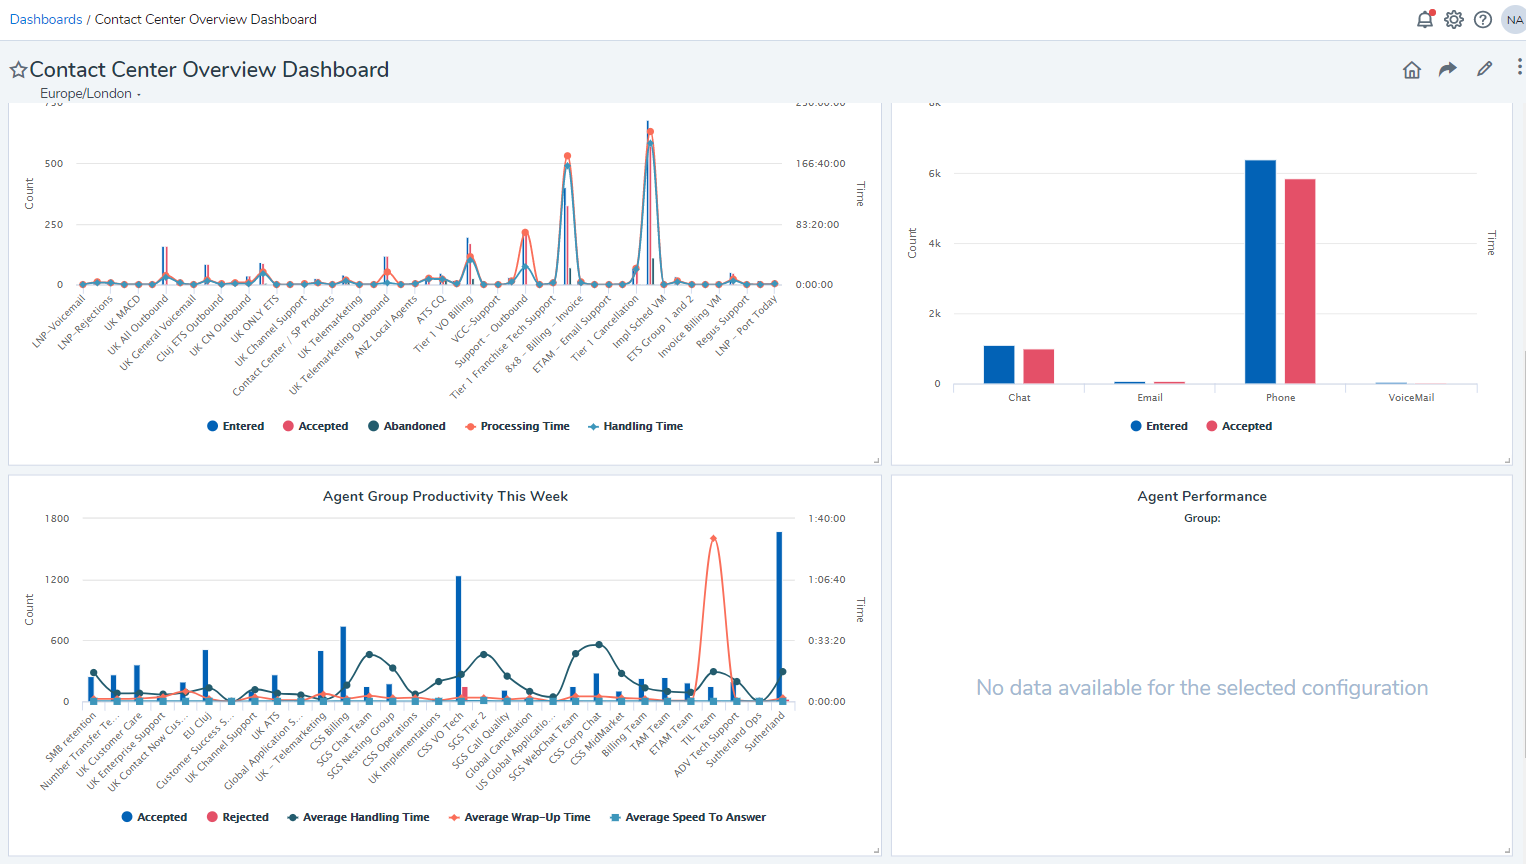
Introducing the Contact Center Overview dashboard
Monitor your business performance with a predefined dashboard with many key widgets that will help your business needs. Whether you are tracking average waiting time of queues this past month or comparing average wrap-up time of agents, find it all in the Contact Center Overview Dashboard out of the box. We have designed the dashboard with historical and real-time widgets showing key performance indicators.
From the menu, go to Dashboards to access the Contact Center Overview dashboard,
Enhancements to dashboards
We introduced some visual enhancements to the dashboards and wallboards.
Ability to adjust display font size of wallboards
With the new enhancement, you can adjust the font size of wallboard data directly from the wallboards. Simply click the edit icon on the top right corner of the wallboard to adjust the font size to suit your preferences.
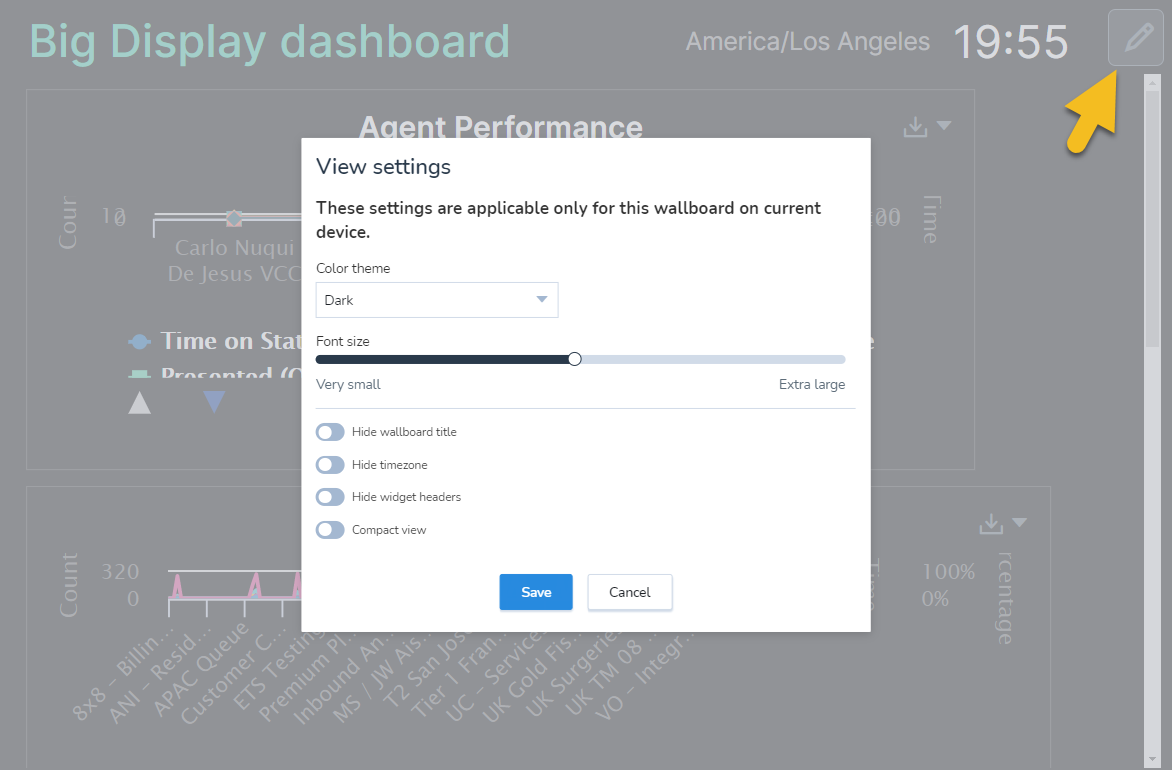
Note: The font size changes:
- Apply to the wallboard being edited only.
- Available to this user and on the selected browser only.
- Remain set indefinitely until edited.
Flexibility to view more data
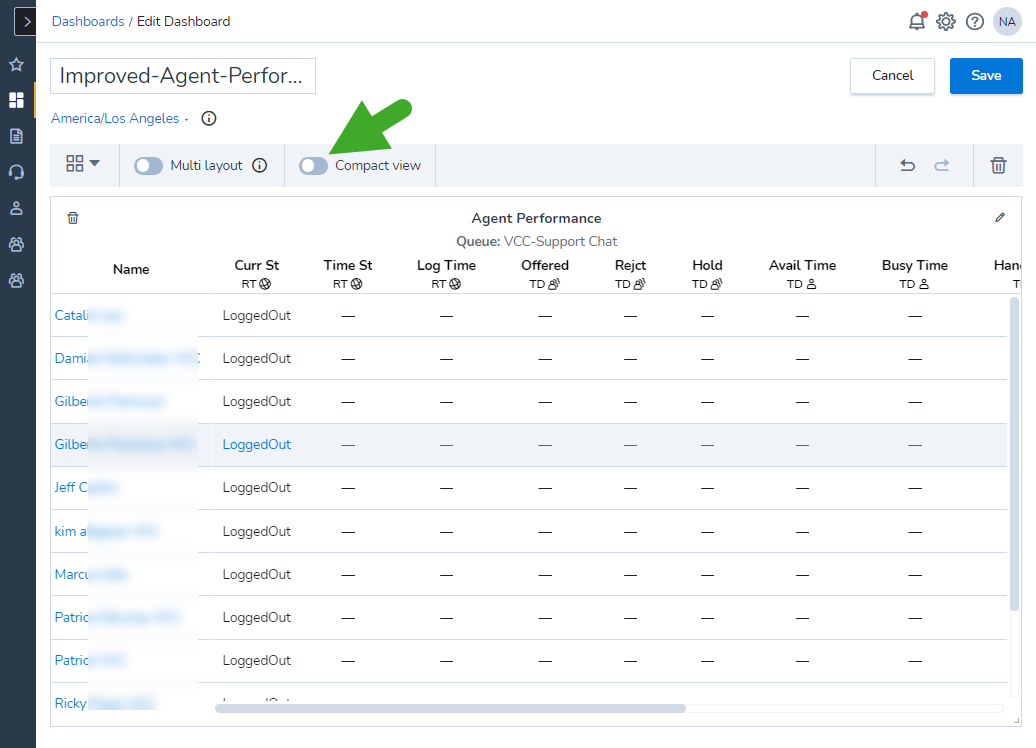
To accommodate more data in the available wallboard space and to optimize the real-estate of the dashboards, we have introduced the option to display data in a compact view. With the compact view option, you can fit more data on the wallboards. When enabled, this option reduces additional space between the rows and displays more data within the available screen space.
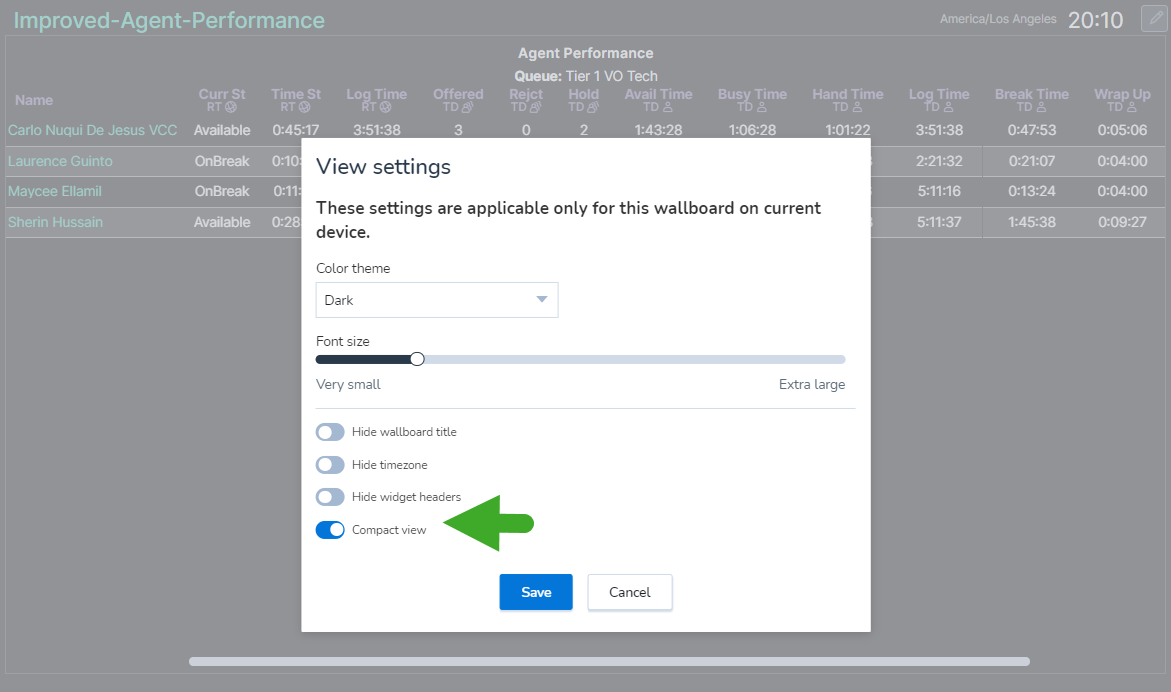
You can also enable the compact view option in the dashboard view within the 8x8 Analytics for Contact Center application. It reduces the space between the widgets in the dashboard.
Bold color palette for threshold visual notifications
We have now updated the color palette for threshold notification on the wallboards. The colors alerting the thresholds are now carefully selected to be easily distinguishable and visible from a distance. The palette for visual notifications now uses bright and contrasting colors.
Note: The existing threshold notification will not be updated automatically. To update the existing thresholds, you will need to edit and manually select colors from the updated palette. All new thresholds will automatically inherit colors from the updated palette.

What are dashboard widgets?
Use widgets to define the metrics you wish to view in your dashboard. Monitor agent and queue performance in real-time or track historical data using widgets. Customize these widgets to filter data to suit your business needs.
Widget types
8x8 Analytics for Contact Center offers two types of widgets to create your own dashboards:
-
Historical widgets: These widgets allow you to create visual data charts with historical information. Access the historical data about queue activity or agent activity for yesterday, last 7 days, last 30 days or more. Whether you are tracking weekly activity of queues or agents, customize your dashboard with the following historical widgets:
Note: Historical widgets refresh every hour.
- Agent Activity: Get to know the number of interactions accepted, rejected, abandoned by individual agents. Compare these metrics with other agents serving the same queue or agent group. How has agent John performed compared to agent Lee? How is their average handling time?
- Agent Group Activity: Access key performance metrics for an agent group and compare them with other agent groups.
- Queue Activity: Get to know if the waiting time for a queue spiked this past week? Was it related to the number of interactions that entered the queue? Get these vital metrics, understand any correlations, and make business decisions.
- Media Activity: Use this widget to track key metrics such as average waiting time, processing time, and number of interactions by media type. What’s the average waiting time for voicemails? Which media type do we experience the longest waiting time? and more.
-
Real-time widgets: Allow you to access the key performance indicators for queues and agents in real time or in short time intervals. Whether you are tracking the number of agents available to take calls in real-time or the average waiting time in the last 30 mins, get the data in real time using these real-time widgets.
Note: Real-time widgets refresh approximately every five seconds.
- Queue Summary: See an overview of all your queue metrics. How many interactions have entered, accepted, abandoned, and the averages?
- Agent Performance: Track how agents in a specific queue are handling the interactions. How many calls has John handled in the past 30 minutes, how many has he abandoned, what is his average call handling time, wrap-up time, and more?
- Agent Status: See an overview of the status of agents in a specific queues. How many agents are available, on break, working offline and more? The supervisor can watch if the number of available agents drops below 2, and take necessary steps if the queue traffic is high.
- Agent Resources: Monitor the status of each agent in real time, watch how long they have been on a call, see whether it is inbound or outbound, and see the caller ID and Caller number.
- Single Agent Stat and Single Queue Stat: Access critical KPIs quickly on your dashboard without having to hunt for them on your data-rich dashboard. Select an important agent or queue performance metric, and create a widget to display it prominently on your dashboard. With improved visibility, you can get to the numbers quickly, and act to take corrective actions.
Use cases
To better understand the power of 8x8 Analytics for Contact Center, let’s look at the following simple use case.
John is one of the supervisors in the contact center at AcmeJets, an airline operating in the United States. AcmeJets operates domestic flights across the country, and handles numerous interactions with the customers via their contact center. Whether for booking tickets, changing or canceling tickets, or simply checking the flight schedule, John’s team of agents are constantly busy assisting customers. John supervises agents belonging to the Tier 1, Tier 2, and Tier 3 queues. Given the high call traffic, John is required to:
- Monitor the call traffic of call queues for Tiers 1, 2, and 3.
- Track the availability of agents in each queue, and view the status of each agent in real time.
- Supervise the performance of agents in each queue at regular time intervals.
- Set thresholds for critical metrics to ensure quick and timely action.
- Project the queue performance and agent status data on the contact center floor.
- Share the metrics with his boss.
Using the 8x8 Analytics for Contact Center tool, John can manage these responsibilities smoothly. He will take the following steps to ensure access to the right metrics.
To create his daily dashboard, John must add widgets to monitor:
- Queue Summary for Tier 1, Tier 2, and Tier 3.
- Agent Performance for Tier 1.
- Agent status for Tier 1.
- Agent status for Tier 2 and 3.
- Agent Resources for Tier 1.
- Single Queue and Agent Stat widgets.
John must keep the visuals on the dashboard at a minimum so he can stay focused on the critical metrics. Learn about how to create widgets.