What's new in the 8x8 Analytics for Contact Center 2.13 release?
In this release of 8x8 Analytics for Contact Center, we are introducing the following enhancements:
Ability to view the email subject metric in Interaction Details report
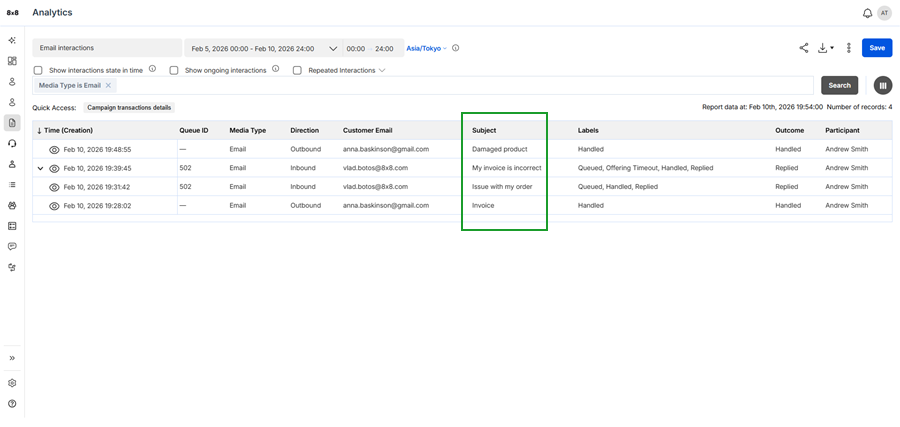
The Subject metric is now available in the Interactions Detailed Reports and Digital Channels Detailed report. It displays the subject line of email interactions, allowing users to better understand the context of each customer conversation.
Note: The Subject metric is currently available only for email interactions.
Benefits
- Faster context recognition: Helps users quickly identify the purpose of an email without opening each record, saving time during reviews.
- Improved categorization: Enables contact center managers to classify and group interactions based on subject themes.
- Proactive issue detection: Facilitates trend spotting across similar email subjects, helping teams address emerging concerns before they escalate.
To include the Subject metric in a report:
- From the menu, go to either Detailed Reports > Interactions, or Digital Channels> Detailed.
- Select a timeline for your report.
- Click the Customize table
 icon from the right-hand side of the search bar to edit the report metrics.
 - Locate the Subject metric in the list.
- Click
 next to the metric to view the metric in the report.
 - Click Save.
- Click Search to view the results.

Note: This metric is currently available only for email interactions.
Introducing new Focus metrics for digital interactions
We have introduced new Focus metrics to help contact center supervisors and managers understand how agents manage concurrent digital interactions such as chats and emails. These metrics show when an interaction was actively open and selected by the agent in 8x8 Agent Workspace. This provides a more accurate view of how agent attention was distributed and helps explain inflated handling time caused by multitasking.
You can add these metrics in the Interactions Detailed Reports and the Agent Interactions Summary report.
Focus metrics in the Interactions Detailed Reports
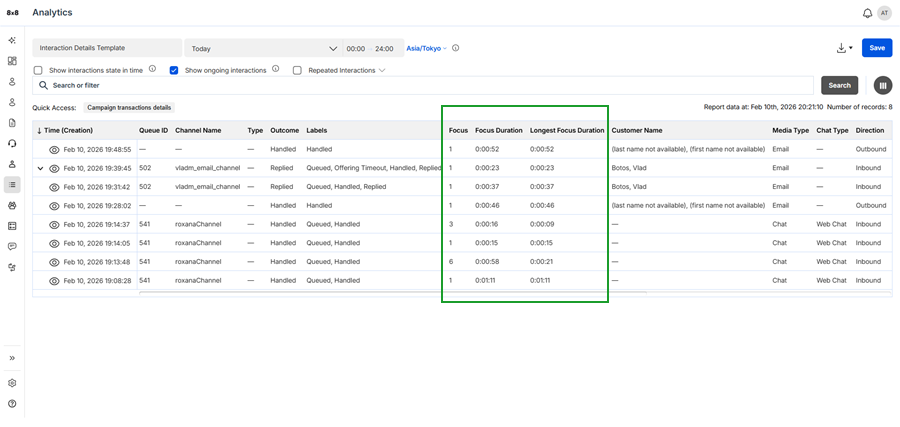
In the Interactions Detailed Reports, you can add the following new Focus metrics.
An interaction is considered in focus when its window is open and visible to the agent in 8x8 Agent Workspace. When the agent moves to another interaction, the original interaction is considered out of focus.
- Focus: The number of times a digital interaction was actively in view in an agent’s workspace.
- Focus Duration: The total time a digital interaction was in focus across all agents who handled it.
- Longest Focus Duration: The longest continuous period a digital interaction remained in focus for any single agent who handled the interaction.
View the focus metric on the end-to-end journey of an interaction
The focus metric is shown on the interaction flow diagram using the Focus ![]() icon. It indicates when the interaction window was actively open and visible to the agent in 8x8 Agent Workspace. Each time the agent switches to another interaction, a focus change is recorded.
icon. It indicates when the interaction window was actively open and visible to the agent in 8x8 Agent Workspace. Each time the agent switches to another interaction, a focus change is recorded.
When analyzing an interaction journey, the focus indicator provides additional context by showing how agent attention was distributed throughout the interaction lifecycle.
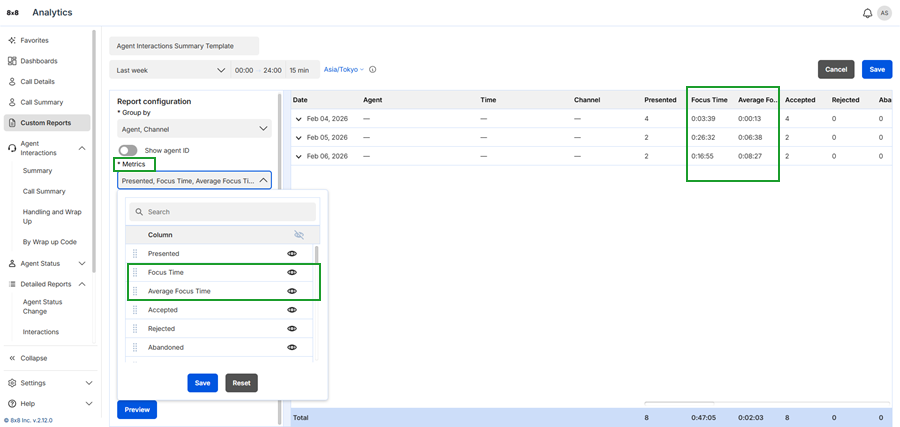
Focus metrics in the Agent Interactions Summary report
You can customize the Agent Interactions Summary report template and add the following Focus metrics.
An interaction is considered in focus when its window is open and visible to the agent in 8x8 Agent Workspace.
- Focus Time: The total time an agent actively viewed and worked on digital interactions.
- Average Focus Time: The average time an agent had digital interactions in focus.
For answers to frequently asked questions about the Focus metric, refer to this 8x8 Support article.
What's new in the 8x8 Analytics for Contact Center 2.12 release?
In this release of 8x8 Analytics for Contact Center, we are introducing the following enhancements:
- Introducing new metrics for Detailed reports
- Ability to filter inbound RCS messages
- Support for outbound email reports
Introducing new metrics for Detailed reports
We’ve added the following new metrics to the Detailed reports to improve visibility into interaction routing and customer journeys:
- Destination Queue Name
- Destination Queue ID
- Journey ID
You can access these new metrics from the Interactions Detailed Reports and Detailed Digital Channels reports.
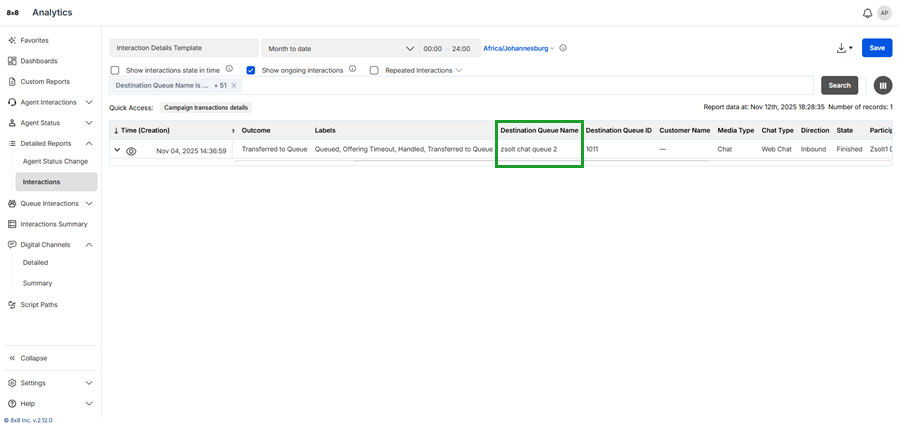
The Destination Queue Name metric
The Destination Queue Name metric shows the name of the queue that received a diverted interaction, such as one routed via overflow or transfer. It helps you understand routing flows and track the full journey of the interaction.
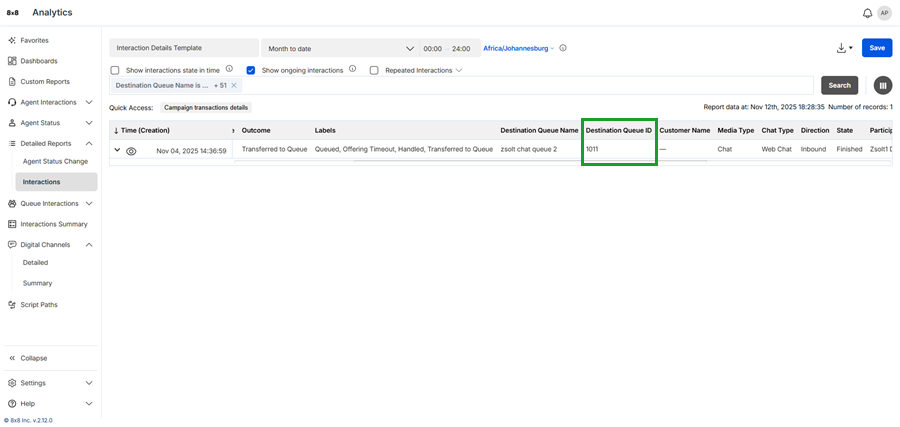
The Destination Queue ID metric
The Destination Queue ID metric shows the unique ID of the queue that received a diverted interaction, such as one routed via overflow or transfer.
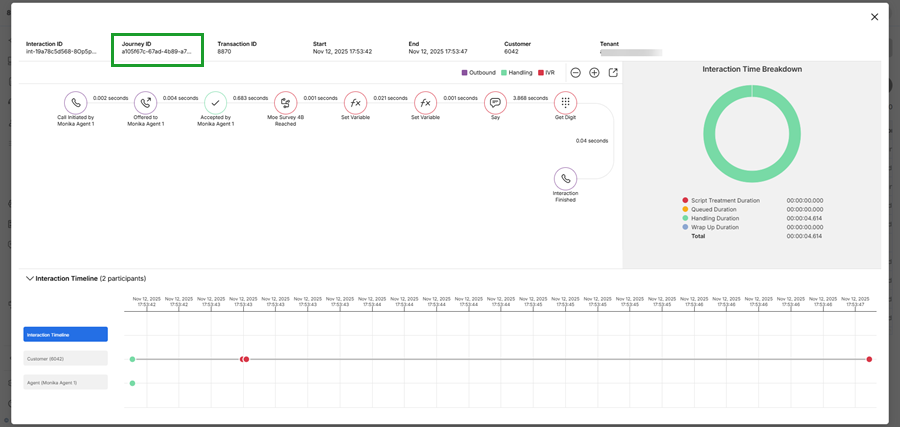
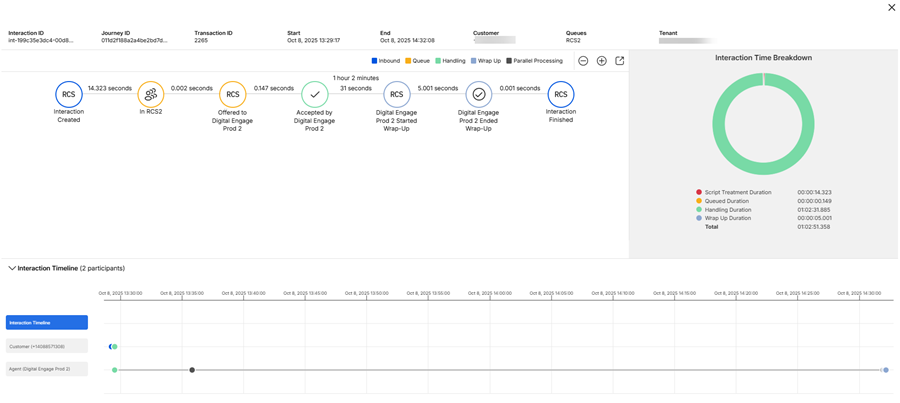
The Journey ID metric
The Journey ID links all segments of an interaction across transfers using a single identifier. This helps teams track and analyze the full customer journey instead of viewing each segment separately.
You’ll see the Journey ID at the top-left of the interaction flow and as a filter metric in the report. Use the Journey ID to find and review every segment from start to finish.
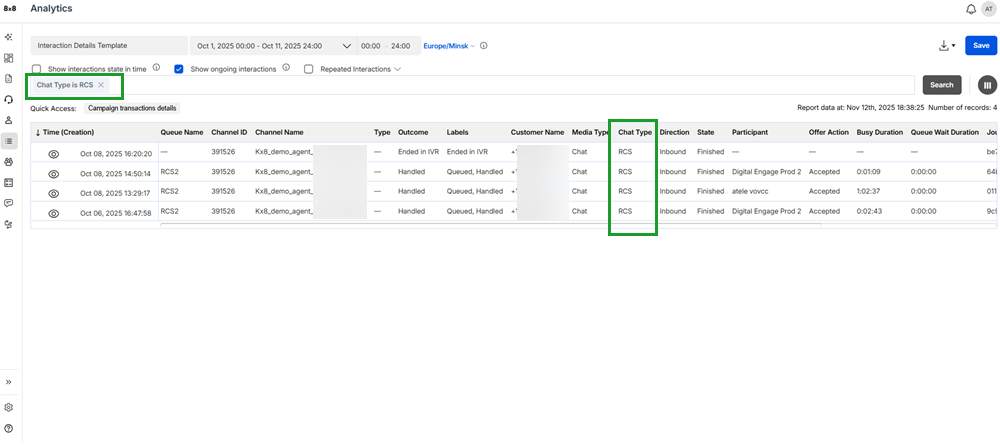
Ability to filter inbound RCS messages
You can now filter inbound Rich Communication Services (RCS) in 8x8 Analytics for Contact Center. This new filter allows you to track and analyze inbound RCS traffic separately from other messaging channels.
RCS appears as a Chat Type option in these reports:
- Interactions Detailed
- Digital Channels Detailed
- Digital Channels Summary
You can also:
- Retrieve RCS data using the Public API.
- See RCS interactions directly in the interaction flow, marked with an RCS icon.
- From the menu, go to Detailed Reports > Interactions.
- Or -
Digital Channels > Detailed. - Select a date range.
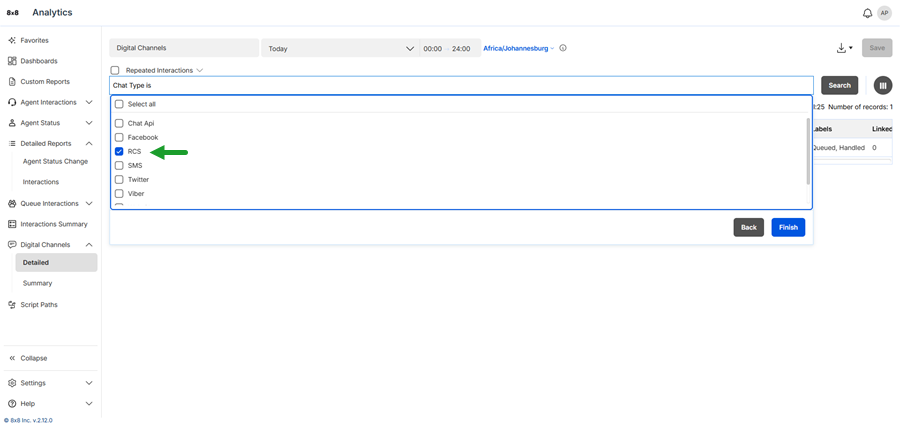
- Click the filter bar and select Chat Type from the filter list.
- Select the operator <is> from the list to ensure the filter focuses only on exact matches.
- Select RCS.
- Click Finish. The compound filter <Chat Type is RCS> displays in the filter bar.
- Click Search to view matching data.
- (Optional) Click Save to reuse this report later.
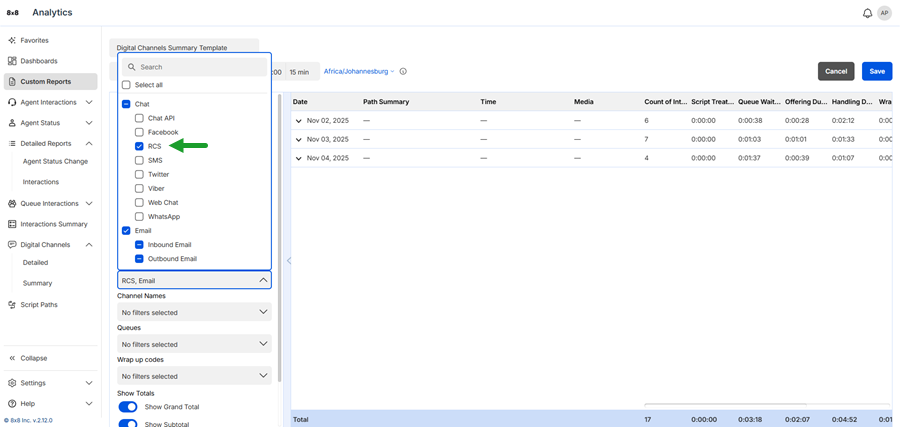
- From the menu, go to Digital Channels > Summary.
- Click Customize.
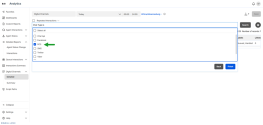
- From the Report configuration panel, go to Media.
- From the Chat list, select RCS.
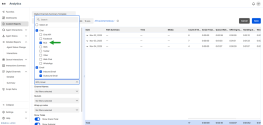
- (Optional) Click Save to reuse this report later.
Support for outbound email reports
You can now track outbound emails in your reports using the Direction filter. Set the filter to Outbound to view emails sent by agents only.
This filter option is available in:
- Interactions Detailed
- Interactions Summary
Use this filter to separate inbound from outbound email activity in your reports.
For more information, see Access report for replied customer emails.
To learn more about features and enhancements introduced in the past, check out previous releases.