Manage queues
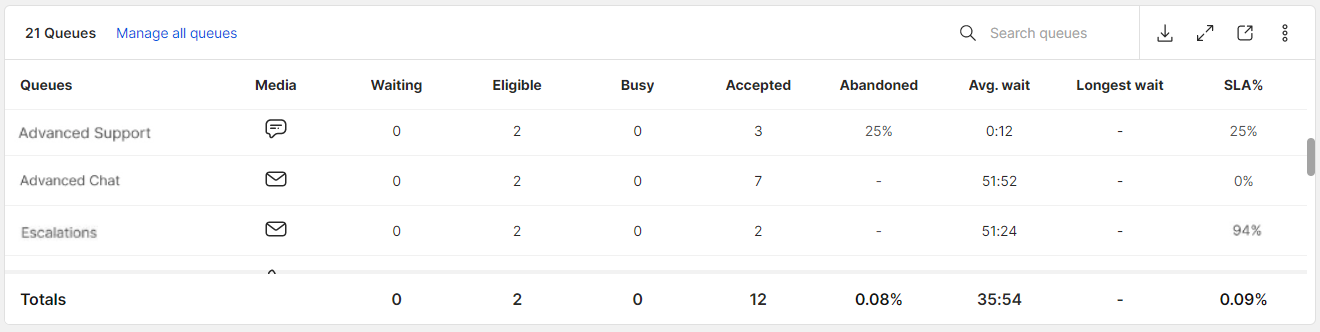
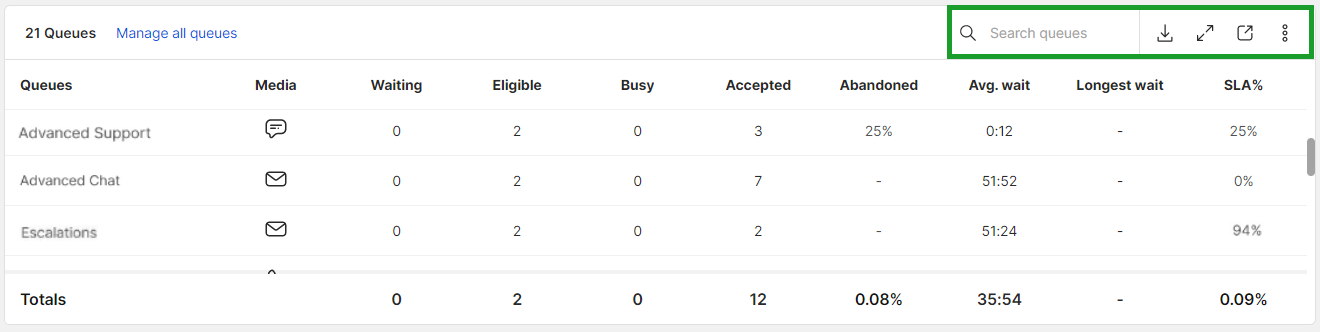
With 8x8 Supervisor Workspace, you can view metrics for each monitored queue in the Queues table. They include:
- Media: The media type associated with a queue is displayed. You can sort by the most important queue by clicking the Media column header. For example, you can display phone queues at the top of the list to help you closely monitor phone-related metrics.
- Waiting: The number of interactions waiting in a queue is displayed. As a supervisor, you can take action on any queue with many interactions waiting to be answered. You can assign additional agents to a particular queue, in an effort to help with service levels. Click the column header to sort queues by the most or least number of pending interactions.
- Eligible: The number of agents eligible to receive interactions is displayed. As a supervisor, you can see the number of agents you have available. If there are too many interactions waiting to be handled in a particular queue, you can assign some of these eligible agents to that queue. Click the column header to sort by the queue with the most or least number of available agents.
- Busy: The number of agents currently handling interactions is displayed. Click the column header to sort queues by the most or least number of agents currently handling interactions.
- Accepted:The total number of interactions accepted by agents for each queue is displayed. Click the column header to sort queues by the most or least number of agents that have accepted interactions.
- Abandoned: The number of abandoned interactions is displayed. Click the column header to sort queues by the most or least number of abandoned interactions. As a supervisor, you can take action if you notice that too many interactions are being abandoned.
- Avg. wait: The average wait time for an interaction is displayed. Click the column header to sort queues by the longest or shortest average wait time. You can add available agents to queues with long wait times in order to help meet your service levels.
- Longest wait: The longest wait time for an interaction in a queue is displayed. Click the column header to sort queues by the longest or shortest wait time. You can add available agents to queues with interactions that are waiting to be handled.
- SLA %: The current service level for a queue is displayed. As a supervisor, you can determine how well queues are performing, and whether they are meeting their SLA targets. Click the column header to sort queues by the highest or lowest service level.
- Enabled: The number of agents logged in, assigned, and enabled for the queue.
Note: To manage queues in 8x8 Supervisor Workspace, ensure your administrator has assigned you with the required supervisor permissions in 8x8 Configuration Manager. To learn more, see grant supervisor rights.
As a supervisor, you can export the Queues table as a PNG file by clicking ![]() . You also have access to additional features, such as adding a queue as a favorite. To learn more, see queues table features.
. You also have access to additional features, such as adding a queue as a favorite. To learn more, see queues table features.
The following table lists and describes some of the data displayed:
| Field | Description |
|---|---|
| Queues | Lists all the queues being monitored |
| Media | Lists the media type associated with each queue. |
| Waiting | The number of interactions waiting to be processed in a queue. |
| Eligible | The number of agents enabled to receive interactions. |
| Busy | The number of agents whose status is set to Busy. |
| Accepted | The number of interactions answered by agents. |
| Abandoned | The number of interactions not answered by agents. |
| Average Wait | The average wait time for an interaction before being processed. |
| Longest Wait | The longest wait time for an interaction before being processed. |
| SLA % | The current service level for a queue. |
| Enabled | The number of agents logged in, assigned, and enabled for the queue. |
| Available idle | The number of agents enabled, assigned, and in the Available state (idle waiting). |
| SLA Target % | The target percentage of interactions that meet the SLA. This metric doesn't apply to Outbound Phone Queues. |
As a supervisor, you can select a queue as a favorite from the Queues table. You can also access additional features, such as enabling an agent for a queue and viewing a list of agents in a queue.
As a supervisor, you can closely monitor certain queues by selecting them as favorites. These queues will always appear at the top of the Queues table.
To select a queue as a favorite:
- Locate the queue from the Queues table.
- Click Toggle Favourite next to the queue you would like to include in your favorites. The favorite icon changes from
 to
to  .
. 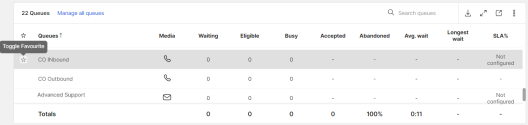

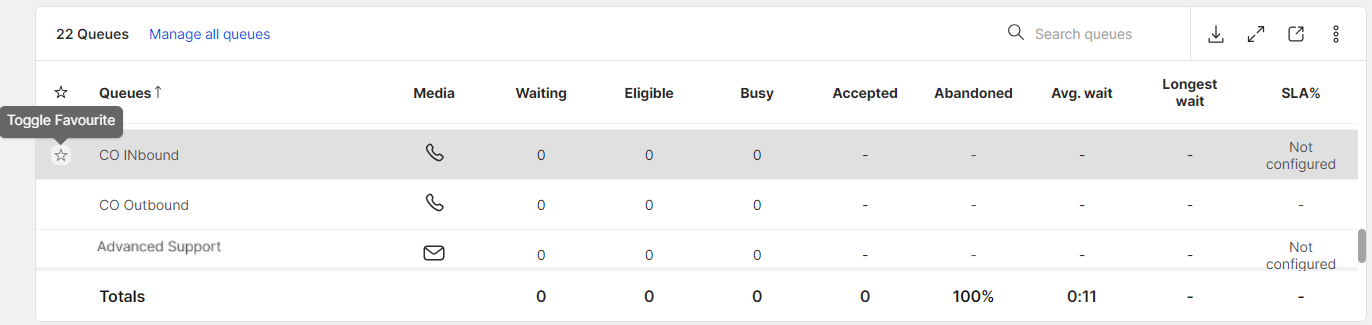
Note: To remove a queue as a favorite, click Toggle Favourite again.
Supervisors have access to additional features in the Queues table.
- Search queues: Enter a queue name in the search field to display metrics relevant to that queue
- Export: Select
 to export the queues table as a PNG file
 - Expand: Select
 to maximize the queues table
 - Collapse: Select
 to minimize the queues table
 - Pop out: Select
 to view the queues table in a new window
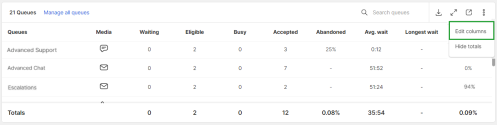
 - Show more: Select
 to display an additional menu to either hide or show totals for queue metrics
As a supervisor, you can customize the Queues table to only display relevant columns. You can re-order a column, add or remove a column from your table. Configuring these columns allows you to closely monitor queue metrics that are important to you and your business.
To configure columns in the table:
- Navigate to the Queues table.
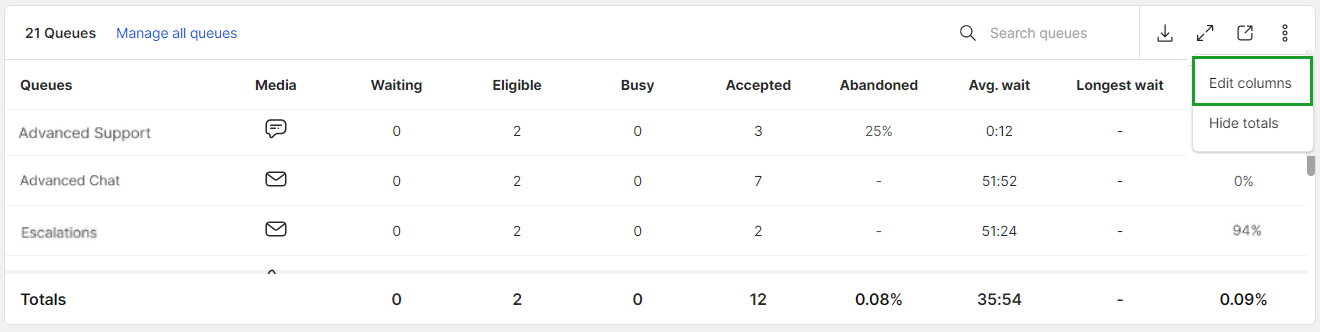
- Click Show more and select Edit columns.
- An Edit columns window appears. From the Active columns list, drag and drop a column in the order you would like to see it displayed. You can also:
- Click Delete
 next to a column to remove it from the Active columns list.
 - Click Add
 next to a column in the Available columns list to include it in the Queues table.
- Click Delete
- After making your selection, click Save to register your changes.
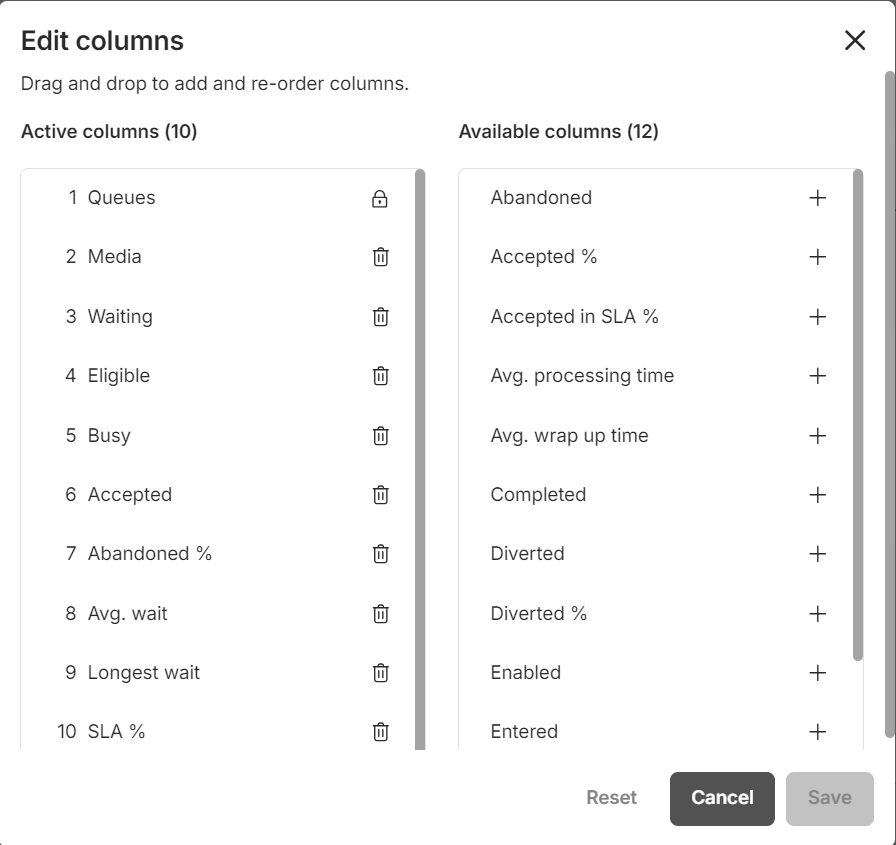
Note: You cannot re-order or remove the Queues column. It will always appear as the first column in the table.
The following table lists and describes the metrics available in the Queues table:
| Metric | Description |
|---|---|
| Abandoned | Lists the number of interactions that terminated in a queue and ended up as being hung up by the customer. |
| Abandoned % | Lists the percentage of interactions that terminated in a queue, in relation to the number of interactions that entered a queue. |
| Accepted | Lists the number of interactions answered by agents. |
| Accepted % | Lists the percentage of interactions answered by agents, in relation to all interactions. |
| Accepted in SLA % | Lists the percentage of interactions answered by all agents under the SLA threshold time, in relation to the number of all accepted interactions. |
| Avg. processing time | Lists the average time an agent spent in the Handling and Wrap Up states (from the time an interaction is accepted by an agent until it is wrapped up) in a queue. |
| Avg. wait | Lists the average wait time all interactions have spent waiting in a queue. |
| Avg. wrap up time | Lists the average time an agent has spent in the Wrap Up state in a queue. |
| Busy | Lists the number of agents in the Offering, Handling, or Wrap Up states. |
| Completed |
Lists the number of agents finishing up work on an ending interaction. |
| Diverted | Lists the number of interactions that entered and left a queue without being terminated. Some of these interactions were either forwarded to another queue, transferred, or forwarded within an IVR script. |
| Diverted % | Lists the percentage of all interactions that entered and left a queue without being terminated, in relation to the total number of interactions that entered a queue. Some of these interactions were either forwarded to another queue, transferred, or forwarded within an IVR script. |
| Eligible | Lists the number of agents that are eligible to receive an interaction. It does not include agents whose status is set to On Break. |
| Enabled | Lists the number of agents logged in, assigned, and enabled to handle interactions for a queue. |
| Entered | Lists the number of interactions that entered a queue. For inbound interactions = Accepted interactions + Abandoned interactions + Diverted interactions + Waiting in queue interactions. |
| Longest wait | Lists the current longest wait time for interactions in a queue. |
| Media | Lists the type of media associated with a queue, such as phone, chat or email. |
| Offering | Lists the number of interactions that are currently being presented to agents. |
| On-break | Lists the time the agent has spent in the On Break state. |
| Queues | Lists the name of all queues being monitored. |
| Short abandonment | Lists the number of interactions that entered a queue and ended up as being hung up by the customer, within the short abandonment threshold. |
| Short abandonment % | Lists the percentage of all interactions that finish (end) in abandonment but are under the short abandonment threshold divided by all entered interactions. |
| SLA % |
Lists the percentage of interactions accepted by agents before the SLA waiting time threshold is reached, in relation to the number of interactions that entered the queue. SLA % = Accepted in SLA / (Entered - Short Abandoned - (Ongoing Interactions < SLA Threshold Time)) * 100 |
| Waiting | Lists the number of interactions waiting in a queue. |
From the Queues table, you can manage all agents assigned to you by clicking Manage all queues. From the Manage agents in all queues window, you can:
- Search for a queue or agent
- Enable an agent to handle interactions
- Disable an agent from handling interactions
- View queue assignments of agents
- View the number of agents assigned to each queue

To enable an agent for a queue:
- Locate the agent from the Manage agents in all queues window.
- Enable the toggle for the desired queue. Select Enable all to enable all assigned agents to a queue.
- Click Save.
To disable an agent from a queue:
- Locate the agent from the Manage agents in all queues window.
- Disable the toggle for the assigned queue. Select Disable all to disable all assigned agents from a queue.
- Click Save.
As a supervisor, you can view a list of agents assigned to a particular queue from the Queues table. Select a queue name to view the agents assigned to that queue, agent statuses, and other agent-related metrics in the Agents table below. To learn more, see manage agents.
In this example, we selected the Chat Sales CO queue. The Agents table lists the number of agents assigned to that queue, along with other agent-related metrics.
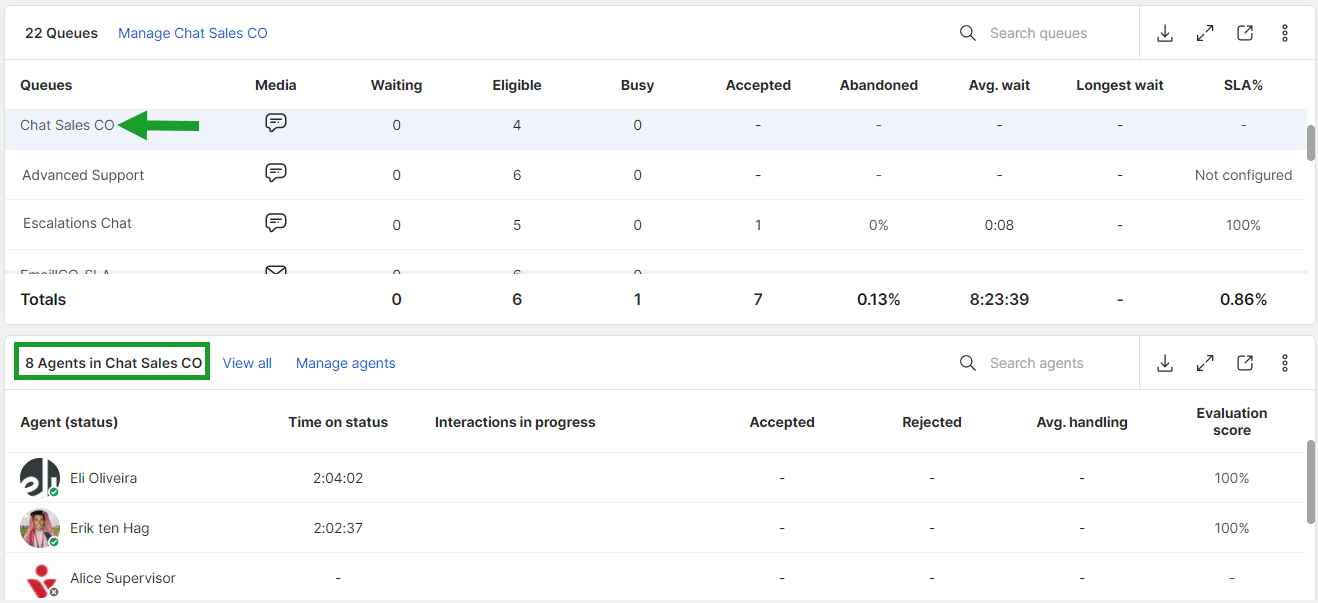
Note: To revert to the list of all agents, click View all from the Agents table.
Click Manage [Queue name] to view a detailed list of all agents in the queue. In this example, we clicked Manage Chat Sales CO. The window displays a list of assigned and unassigned agents. It also identifies the agents enabled to handle interactions.
To learn more about agent queue assignments, see assign agents to queues.
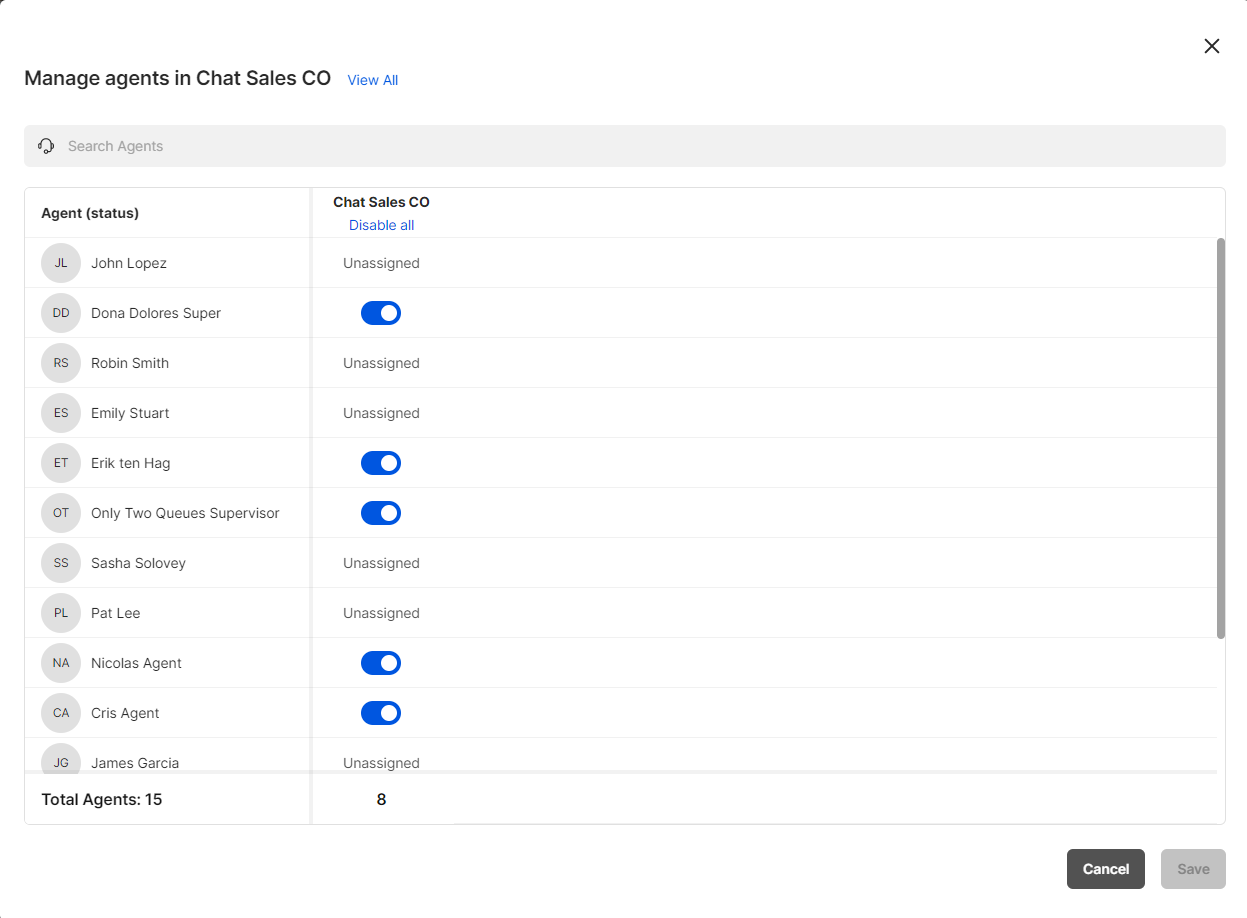
Click Cancel or X to close the window.