Get started
8x8 Supervisor Workspace provides insights into your 8x8 Contact Center, and empowers supervisors to take quick actions to meet customer expectations. As a supervisor, you can:
- Track the status of agents and queues
- Track agent and queue performance metrics
- View the number of interactions in a queue
- View the number of agents assigned to a queue
- Enable or disable agents from a queue
- Export the agents and queues tables as PNG files
Log in
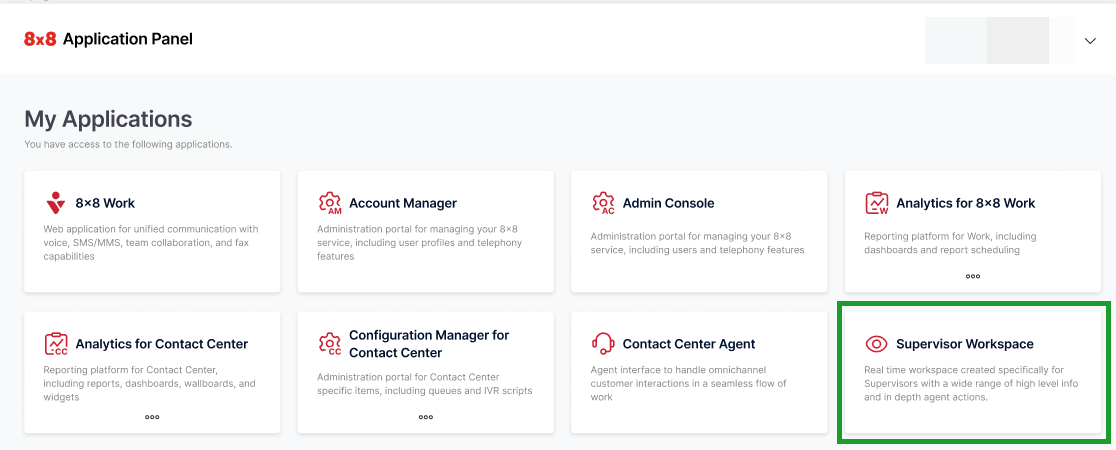
You can access the 8x8 Supervisor Workspace through the 8x8 Contact Center application panel.
To log in to 8x8 Supervisor Workspace:
- In your preferred browser, enter https://login.8x8.com/.
- From the 8x8 login page, enter your username or email address and click Continue.
- Enter your password and click Login.
- The 8x8 application panel launches, listing all the applications available to you. Select the 8x8 Supervisor Workspace application.
Know the interface
When 8x8 Supervisor Workspace launches, you will see a dashboard displaying real-time queue and agent metrics.
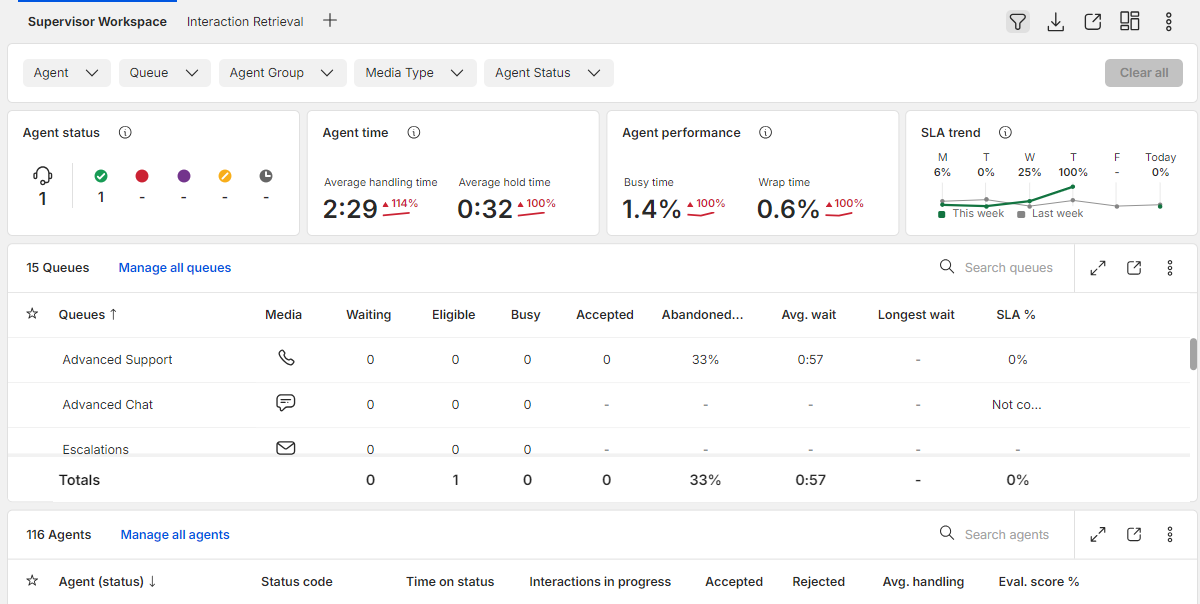
The interface is pre-configured with the following agent and queue widgets:
-
Agent status: The Agent status widget displays the total number of agents assigned to you, along with their statuses.
- Available: It indicates the number of agents available to receive a new interaction.
- Busy: It indicates the number of agents handling a queued interaction.
- Working offline: It indicates the number of agents not available to receive a new interaction.
- Logged out: It indicates the number of agents logged out of the 8x8 Agent Workspace.
- Queue status: The Queue status widget displays the current service level for your assigned queue(s). It also displays the number of active and abandoned interactions.
- Media: The Media widget displays the number of interactions for each channel, such as chat, email, phone and voicemail.
- Interaction analytics: The Interaction analytics widget incorporates speech analytics to analyze customer interactions, and displays a summary of topics relevant to those interactions. To learn more, see 8x8 speech analytics.
- Agent performance: The Agent performance widget displays metrics for when agents are busy handling interactions and wrapping up interactions.
- Agent time: The Agent time widget displays metrics for the average time an interaction has spent in a queue, along with the average time an agent spent on an interaction.
- Quality evaluation: The Quality evaluation widget displays the average quality score of your agents. You can set thresholds used to define the range shown for a score. .
- Service level trend: The SLA trend widget displays a 7-day graph of the average service levels for your monitored queues. It also shows a graph for the previous week.
-
Queues: The Queues table displays some of the following metrics:
- The number of monitored queues
- The name of monitored queues
- The media type associated with each queue, such as phone, chat, email, or voicemail
- The number of interactions waiting in a queue
- The number of agents enabled for a queue
- The number of agents currently handling interactions
- The number of interactions being handled by agents
- The number of interactions abandoned in a queue
- The average wait time for an interaction
- The longest wait time for an interaction
- The current service level as defined in your Service Level Agreement (SLA)
- Agents: The Agents table displays the number of monitored agents, a list of agent names, agent statuses, the duration of an agent's current interaction, the number of interactions accepted and rejected by an agent, the average handle time of an interaction, and more.
Note: Some of these features are available in Mobile Supervisor. To learn more, see about mobile supervisor.