Access 8x8 Quality Management and Speech Analytics tools
Quality Management and Speech Analytics for 8x8 Work, also known as Conversation IQ, aims to enhance employee performance by providing efficient evaluation tools and data reports that can be used to quickly identify areas that require improvement. Depending on the role permissions assigned, users can also access the following Quality Management features:
Note: You can only access interaction data for users who have the add-on subscription for QM/SA.
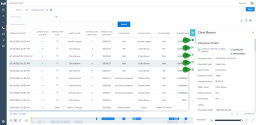
All interactions are available on the Search Interactions ![]() page. Use the available filters to search for an interaction, or apply multiple filters to create a custom filter that you can save for future use.
page. Use the available filters to search for an interaction, or apply multiple filters to create a custom filter that you can save for future use.
Let’s say you are a supervisor and you want to evaluate the voice interactions of one of the 8x8 Work users. You can easily search for interactions using filters. From the Search Interactions ![]() page, select the date for the interactions you want to view. From the Filter and search bar, select Interaction source > is > Generic voice to filter all voice interactions, then select Agent name > is to filter the user by name, and click Search. The search now displays the user’s generic voice interactions for the selected date.
page, select the date for the interactions you want to view. From the Filter and search bar, select Interaction source > is > Generic voice to filter all voice interactions, then select Agent name > is to filter the user by name, and click Search. The search now displays the user’s generic voice interactions for the selected date.
To search for an interaction:
- Log into 8x8 Application panel.
- Click Quality Management & Speech Analytics.
- From the menu, click Search Interactions
 .
. - In the Filter and search field, select the relevant filter, click Finish > Search > Save.
If you search for an interaction using the agent name and interaction source filters, the filter string is shown as in the following example:
Interaction source + is + Generic voice + Agent name + is + <user name>
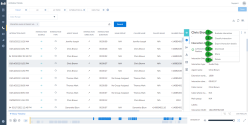
Select an interaction to display the Interaction Details panel. Use the options available on the side menu, or select the More![]() menu option to reveal more actions.
menu option to reveal more actions.
Note: The options available vary depending on the interaction type.
From the side menu options on the interactions details panel you can access:
- Interaction details: Displays details such as interaction data, type, agent name, and much more.
- Interaction snippets: Access the saved snippets from the interaction.
- Speech and transcript: Access the transcription, and search the transcription for keywords of interest.
- Evaluations: Access the evaluations available for the interaction. If the user has permission to view evaluations from other users, the list also displays those evaluations.
- Notes: Access notes added during the evaluation, or delete existing notes.
From the More ![]() options menu on the interactions details panel you can:
options menu on the interactions details panel you can:
- Evaluate interaction: Select to evaluate the interaction using QA templates.
- Classify interaction: Select to process the transcription and add the interaction to a topic in Content Analytics Center.
- Export interaction details: Select to print the interaction details.
- Download: Select to download the interaction. Voice interactions are downloaded as mp3 files.
- Share: Select to generate a link that can be shared with other QM/SA users. The link displays interaction details, and allows the receiver to download a copy of the interaction.
- Delete: Select to delete the interaction.
Evaluate phone interactions
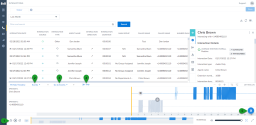
Click on a phone interaction to listen and evaluate the call. At the bottom of the page, click Show Timeline and use the following features:
- Play/pause: Use the play/pause icons to listen to the recording.
- Events: Click to display available events in an interaction. While a call is recorded, the system reviews the interaction and sets event details such as emotions, and mute/unmute actions. Events make it easier for the user to identify sections of interest in an interaction.
Let’s say you are evaluating a phone interaction, and you want to highlight the parts of the conversation that registered as positive. Click Events, and from the drop-down list, deselect all events except Emotion - Mostly Positive. If these events are available in the interaction, smiley face emoticons display on the timeline. - Go to Events: Click and select from the drop-down list the type of events you want to highlight on the timeline. Use the navigation arrows
 located next to the feature name to move from one event to the next.
 - Snip: Use the snip
 tool to cut a specific section of an interaction when you want to refer to that particular recording interval. Snippets are saved in the Search Interactions
  page and are identified using a snip
  icon. Snippets can be evaluated just like regular interactions.
Let’s say you listened to an interaction where the agent told the user that he doesn’t know the answer to a question. Instead of referring to the entire interaction, use the snip tool to cut the exact part of the voice recording you are interested in. Evaluate the snippet, provide useful feedback to the agent, and request coaching to improve customer service. - Show Notes: Use to add a note to the desired timestamp of an interaction. Click on the timeline where you want to provide feedback, and add your comments in the Timestamp field that opens. Notes support @mentions, so use them to notify people and draw their attention to your comment.
All interactions that are evaluated display on the Search Evaluations ![]() page. Incomplete evaluations are identified with a draft
page. Incomplete evaluations are identified with a draft ![]() icon and can be edited at any time. Use the available filters to search for an evaluation or an interaction. Filter queries can be saved for future use.
icon and can be edited at any time. Use the available filters to search for an evaluation or an interaction. Filter queries can be saved for future use.
Let’s say you evaluated a phone interaction this month and you need to follow up with a comment. Instead of scrolling through all evaluations, you can combine search filters to easily find your evaluation.
- From the Search Evaluation
 page, select Evaluated Date > This Month > OK.
 - In the Filter and search bar, select Evaluation modified by > is > <supervisor name> > Finish.
- Next, refine your search filter by selecting Agent name > is > <agent’s name> > Search.
The interactions that match display on the page.
In this case, the combined filter string will look like in the following example:
Evaluation modified by + is + <supervisor name> + Agent name + is + <agent name>
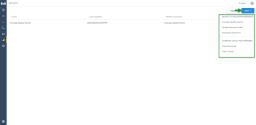
Let’s say you want to see how many interactions were linked to a particular topic over a certain period. You can easily extract this information from the Reports ![]() page. Click New > Topics Matched. From the top of the page, select the dates for which to generate a report, then use the Edit panel to filter the data added to the report.
page. Click New > Topics Matched. From the top of the page, select the dates for which to generate a report, then use the Edit panel to filter the data added to the report.
To generate a Content Analytics Report:
- Click Reports
 .
. - Click New, and select the report type you want to generate - Topic Matched or Topic Trends.
You can create separate reports for Quality Management, and Content Analytics.
For Quality management, you can generate reports based on:
- Average quality scores: Access the average score for evaluations, sections, or questions. These reports can be edited to list average scores for all evaluations, for questions within a specific section, and for individual questions.
- Quality scoring trends: Access average score data for users for a specific period; i.e current week, last month, this year etc.
- Evaluation summary: Access all evaluation scores, points, and comments for users assigned to a specific group.
For Content Analytics, you can generate reports based on:
- Topics matched: Access to view if the available interactions have been linked to at least one topic in the Content Analytics map.
- Topic trends: Access to view how many topics have been linked to at least one interaction, and how it trends over a set period - weeks, months, quarters, years, days, hours.
Customize reports
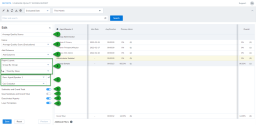
Reports can easily be customized from the Edit panel.
Note: The opinions available in the Edit panel vary depending on the report type selected.
Use the following options from the Edit panel to customize your report:
- Title: Edit the report title.
- Metric: Change the metric of what is reported on.
- Add Columns: Select to add columns such as Average Call Duration and Hire Date.
- Group By: Select to group data by category. You can choose to use single-level groups and sub-groups in your report. This enables you to add a third layer of hierarchy for grouping evaluation data in reports.
- Row/Col: Select which data to display on rows and columns. The fields can be swapped by clicking Swap selections
 .
. - Subtotals and Grand Totals: Toggle on to show subtotals for each subsection, and the grand total.
- Goal Subtotals and Grand Totals: Toggle on to show goal subtotals for each subsection, and the grand total.
- Deactivated Agents: Toggle on to show data for users who no longer have QM/SA add-ons enabled.
- Layer Template: Toggle on to display merged data for questions/sections that have the same title. The merged data is shown as an average of the sections with the same title.
Toggle off to display data for all questions/sections, even if they have the same title

