8x8 Meetings Analytics Beta
Important! This feature is currently available only for limited availability.
As an 8x8 admin or supervisor, you can access the summary of the 8x8 Meetings that took place for your tenant and see detailed analytics such as the date and time of the meeting, the number of participants, shard count, meeting ID, browser, and region distribution.
Audiences
8x8 Meetings Analytics Beta is available to the following types of users:
- 8x8 Admins
- 8x8 Supervisors
Requirements
-
8x8 Admin Console credentials
Features
- Generate reports on the number of meetings or sessions.
- Check the browser or region distribution of participants in a meeting.
- Sort, filter or freeze data in the columns.
- Apply custom filters and extract desired data.
- Export report data to CSV or Excel for further evaluation and archiving.
- Offer managers the ability to monitor meetings, traffic, and logs.
Log in to 8x8 Meetings Analytics Beta
To log in to 8x8 Meetings Analytics Beta:
- Log into Admin Console using your 8x8 admin credentials.
-
In the Admin Console menu, click Meetings > Analytics. The Meetings Analytics dashboard displays the summary of the ended meetings.

Know the interface of 8x8 Meetings Analytics Beta
When the 8x8 Meetings Analytics Beta launches, you see the dashboard with a summary of the meetings, filtering options, the browser, and region distribution of the meetings.
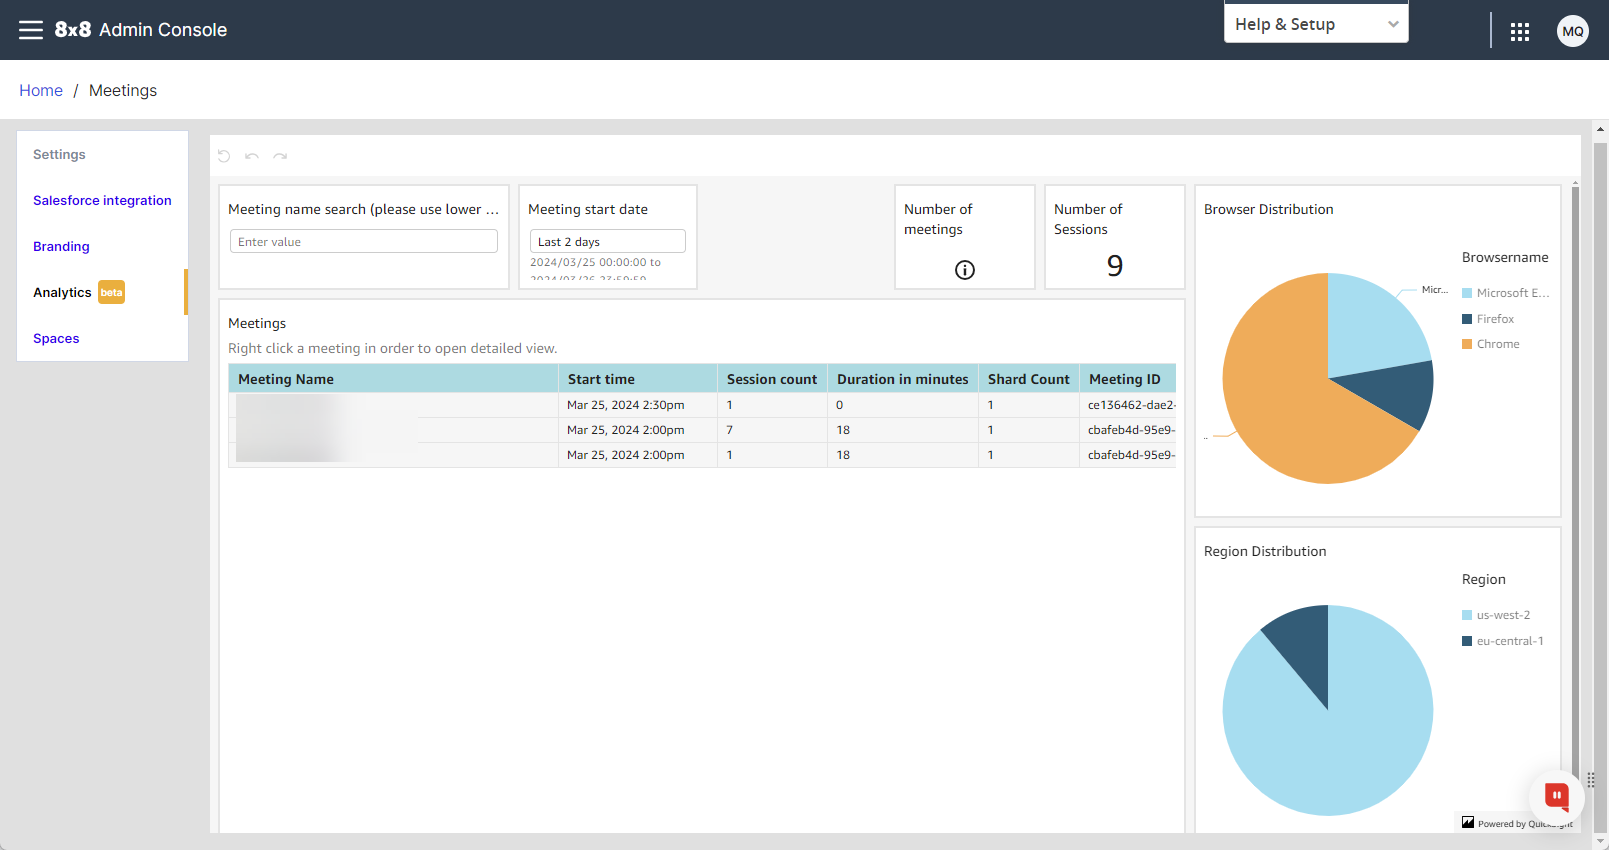
At a glance, you can access information on:
- Browser Distribution chart: Displays what types of browsers users have been using to connect to meetings.
- Region Distribution chart: Plots the distribution of data center regions to which users connect.
- Number of meetings: Number of meetings that match your filter selection.
- Number of sessions: Specifies the number of sessions that match the filters. For example: if a participant rejoins a meeting 10 times, 10 unique sessions will be generated.
- Meetings table: Lists the meetings that match the filters:
Meeting Name: The meeting name that appears in the URL.
Start time: UTC +0 date/time at which the first participant joined the meeting.
Session count: The total number of sessions created during the meeting.
Duration in minutes: Calculated as the time elapsed since the first participant joined until the last participant left.
Shard Count: The total number of shards that were involved in the meeting. If a participant joins from the US and another from Asia, we connect them to localized instances of our servers to achieve better performance.
Meeting ID: Serves as the unique identifier for a meeting.
Meetings details dashboard
The meetings details dashboard provides you with information about audio and video performance, along with other important insights.
Note: The Meetings Analytics data is available only after the meeting ended. No information on the ongoing meeting are displayed.
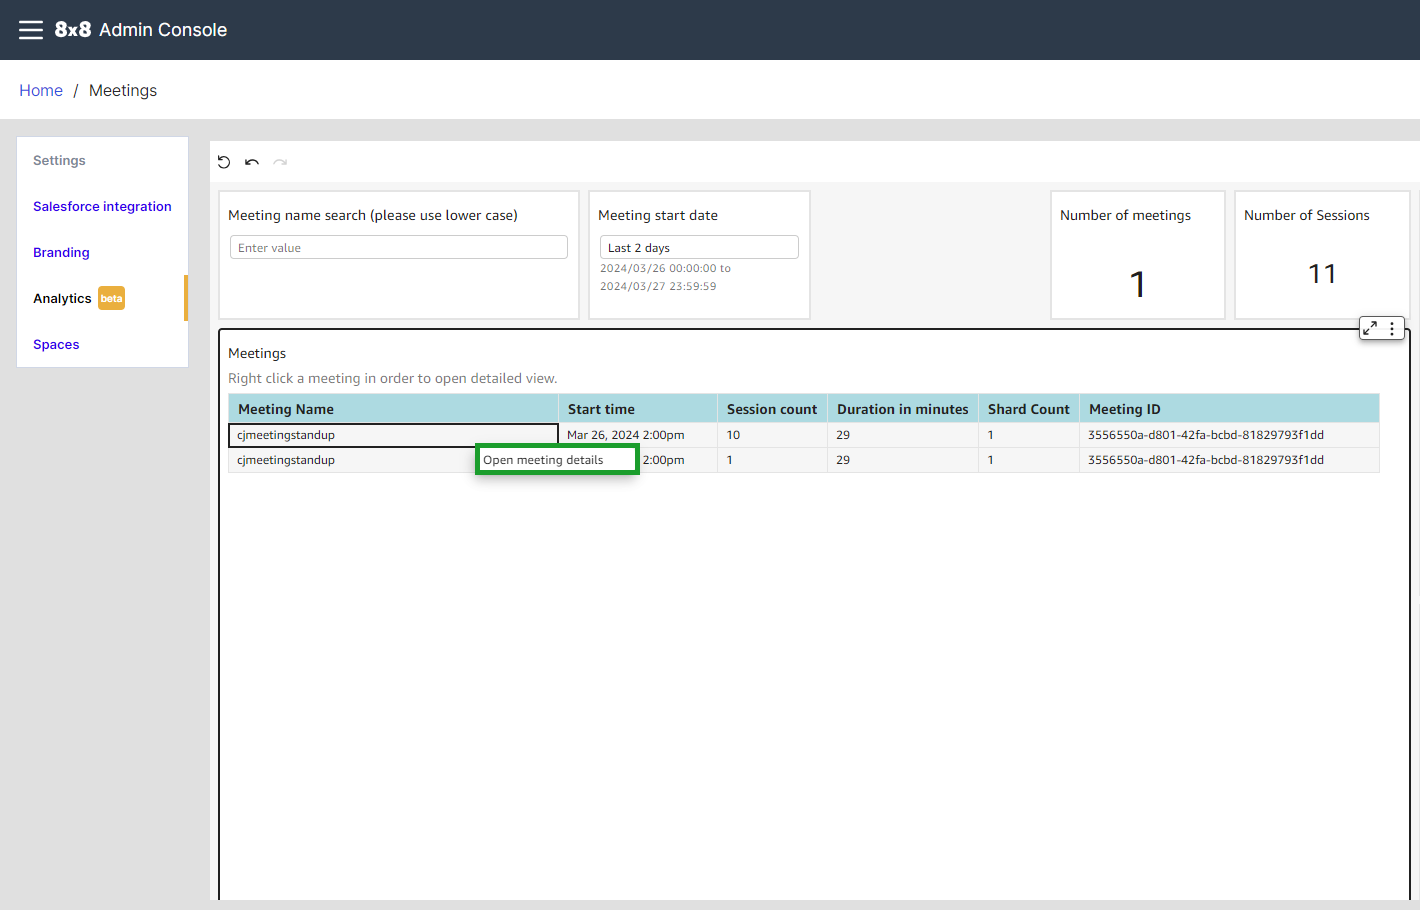
To check the meeting details:
- Go to the Meetings panel.
- Right-click the meeting which you want to see.
-
Click Open meeting details.
-
The meeting details tab displays in a new window. ,
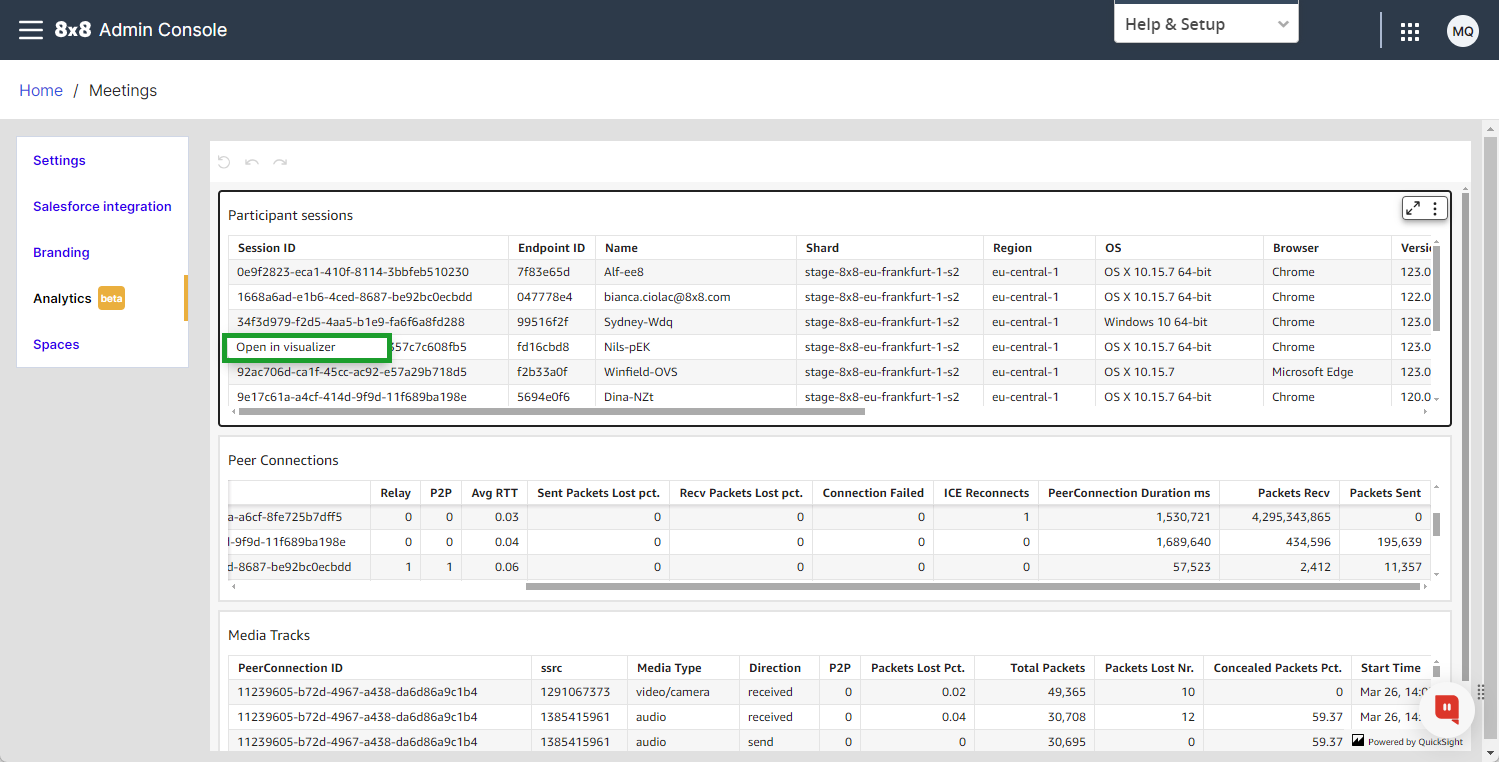
The meeting data is grouped under three main sections:
- Participant sessions displays information on the session and endpoint ID, back-end shard, OS and browser details, and other temporal aspects.
- Peer Connections collects information on participant connections such as the number of reconnections, packets lost and received, and connection duration.
- Media Tracks display the media used by the participants, either video/audio, packets lost during screen sharing, and other temporal aspects.

Note: If a participant reconnects to the meeting, you will see multiple session IDs in the Participant sessions.
By right-clicking a specific Session ID, you can click Open the visualizer and check the Stats and Logs of the that session.