Note: The Customer Experience (CEX) and Post-Call Survey (PCS) Analytics application has reached end of life. Starting August 20th, 2025, CEX/PCS will no longer be available as a standalone product. For more information, refer to this Help Center article.
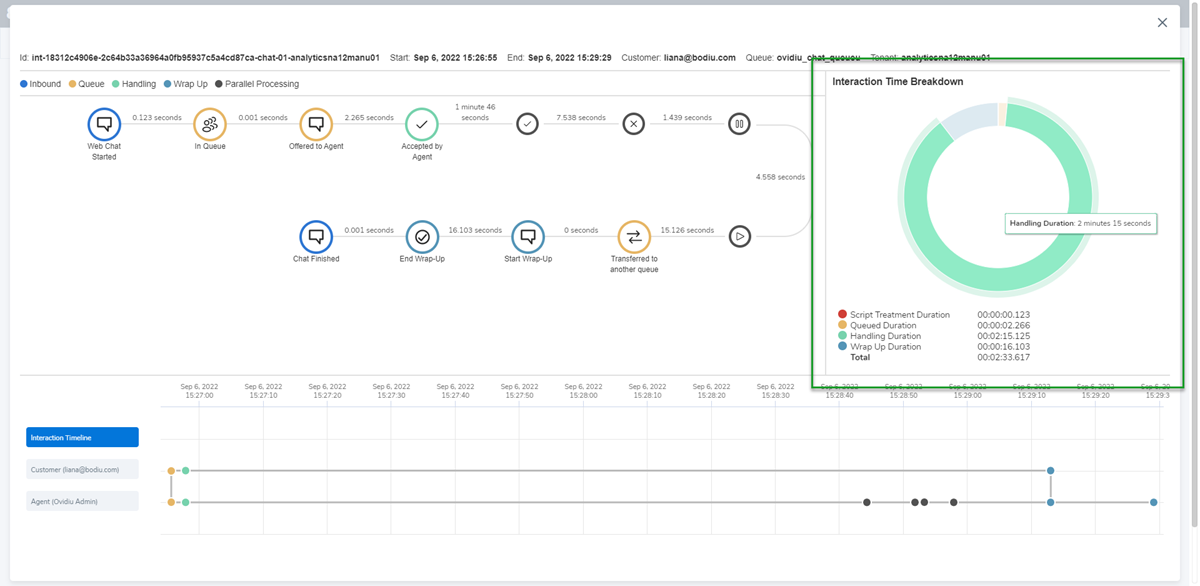
View the Interaction Time Breakdown - Pie chart
Let’s say you want to view the exact handling time for one of your
- Script Treatment Duration: Indicates the total time spent by the customer in the script, excluding the queued time.
- Queued Duration: Indicates the time the interaction spent in a queue - from entering the queue until the interaction was first accepted by an agent.
- Handling Duration: Indicates the duration between the agent action time and handling end time.
- Wrap Up Duration: Indicates the duration between the start-post-processing (coincides with handling end time) and end-post-processing time.
- Total: Displays the sum of all metrics.
Note: You can also hover over each section of the pie chart to view the time details.
View the Interaction Timeline
To view the exact time an event occurred, you can refer to the interaction timeline section. You can select to view:
- Interaction Timeline: This is the default view. When selected, it lists all the events of the interaction.
- Customer: Select it to only display the event legs for the customer. All other event legs are hidden in the interaction flow.
- Agent
 Agents use the Agent Console to view and manage customer interactions. Virtual Contact Center supports Regular agents and Supervisor agents.: Select it to only display the event legs for the agent. All other event legs are hidden in the interaction flow.