Access 8x8 Analytics for Contact Center
8x8 Analytics for Contact Center is a new generation tool that extracts raw contact center metrics and presents data in easily comprehensible visual charts.
To access and learn about the capabilities of 8x8 Contact Center for Analytics, refer to 8x8 Analytics for Contact Center User Guide.
Note: 8x8 Contact Center users in Canada must continue to access the 8x8 Business Intelligence app for analytics.
Access the 8x8 Business Intelligence app (for Canada users only):
- Log in to 8x8 Supervisor
 An agent with the supplementary privileges required to create FAQ categories and answers, monitor agent interactions in progress, listen to recordings of previous interactions, and create reports for the agents groups they supervise. Console.
 - Click
 in the Control Panel.
 - Select Business Intelligence to launch the 8x8 Analytics for Contact Center tool.
The dashboard launches in a separate browser window.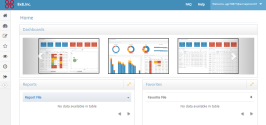
- Use the navigation menu on the left to access dashboards and create custom reports.

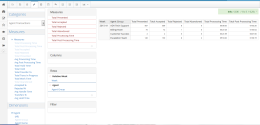
Create an agent-based report
Agents can create reports only for themselves, but supervisors can create a report for the agents they supervise.
- Go to Create Reports from the navigation menu.
- Click the drop-down and select AgentAgents use the Agent Console to view and manage customer interactions. Virtual Contact Center supports Regular agents and Supervisor agents. Transactions.
All the available metrics for agents show up in Measures. - Select the desired metrics such as Total Accepted, Total Rejected, Total Processing time etc.
- Select the desired agent groups by adding Agent GroupA group is a collection of agents created for management or reporting purposes. Groups can be functional (for example, Technical Support) or organizational (for example Supervisor Mary’s Team). Each agent can be assigned to only one group, and cannot view or access information about other groups or group members. in Dimensions.
- Then select a time range for the report such as a desired day, week, month, quarter, or year in Dimensions.
- Click to run the report. The report appears in a table.