Get Device Status Data
Note: The Device Status dashboard replaces the legacy Device Status Detail report. It provides real-time visibility into endpoint availability across sites, helping teams quickly identify devices that are online or offline and resolve issues faster.
The Device Status dashboard provides near real-time visibility into endpoint registration status in your 8x8 cloud phone system. Use it to monitor connectivity, detect service issues, and take action before problems affect users or call center performance.
Benefits
-
Familiar navigation: The dashboard follows consistent 8x8 design patterns, so you can find what you need without a learning curve.
-
Faster troubleshooting: View all and individual endpoint status in one place to quickly identify issues across multiple locations.
-
Targeted filtering: Narrow results by PBX
 Private Branch Exchange—a private telephone network used within a company., Service Type, Device Type, and Device Site to speed up investigation.
 -
Clear ownership: Easily match devices to users to resolve issues faster.
-
Location visibility: View the geographic distribution of endpoints to identify site-specific or location-based issues.
-
Flexible exports: Download endpoint data as CSV or Excel for offline analysis and record keeping.
The Device Status dashboard is available in Analytics for 8x8 Work.
The Device Status dashboard is available in Analytics for 8x8 Work.
To access the dashboard:
- Log in to Analytics for 8x8 Work.
- From the left navigation menu, select Device Report
 > Device Status > Device Status (New).
 - Use filters such as PBX, Service Type, Device Type and Device Site to refine the data. To learn more, see Customize the Device Status dashboard.
 report under Device Report in Analytics for 8x8 Work.")
- Open the Device Status dashboard.
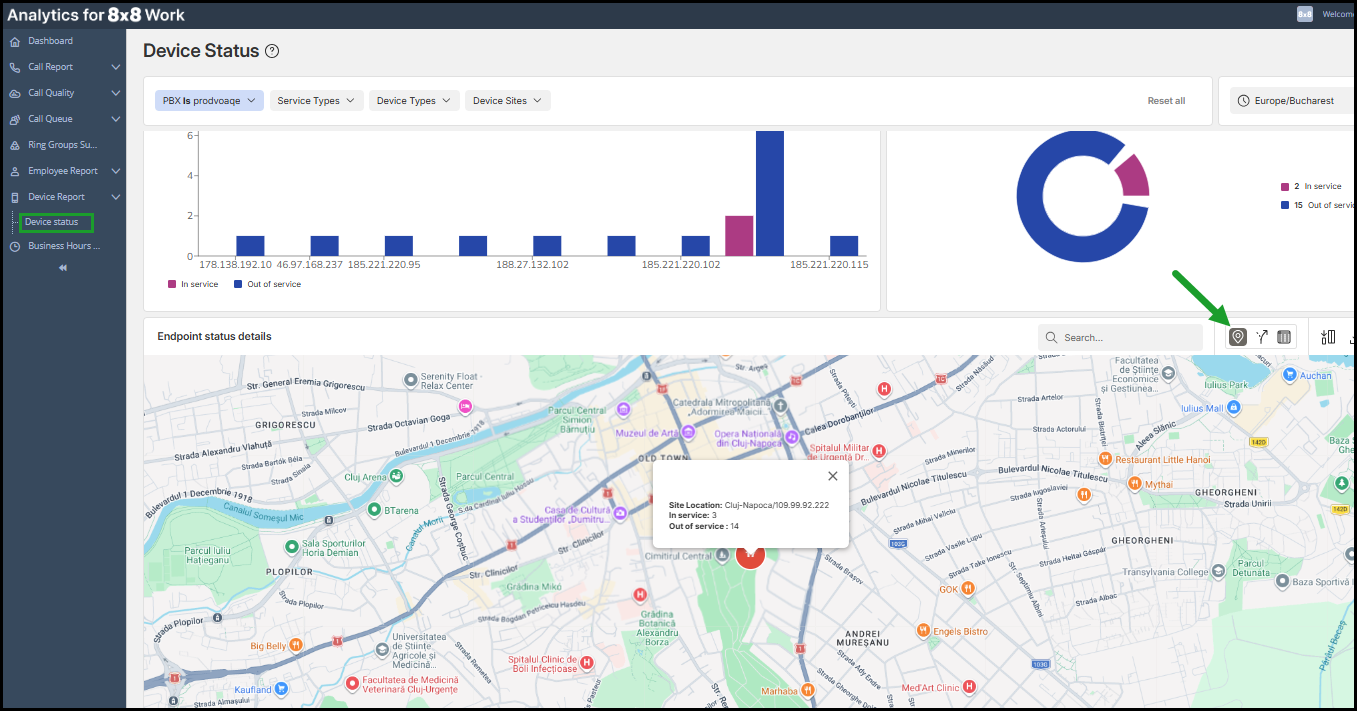
- In the endpoint status details area, use the Site location map
 and the Routing map controls in the upper-right corner to switch between map views. To learn more about maps, see Maps.
 - Apply filters and data selectors to refine the view. To learn more, see Customize the Device Status dashboard.
Note: When viewing the site location map or routing map, select the Endpoint details ![]() control in the upper-right corner of the map to open the endpoints details view.
control in the upper-right corner of the map to open the endpoints details view.

The Device Status near real-time information on endpoint registration status in your 8x8 cloud phone system.
It includes:
- Summary tiles: Total endpoints, total sites, in-service devices, and out-of-service devices. To learn more, see Summary tiles.
- Site endpoint status chart: A visual chart showing device availability per site (which sites have Offline endpoints). The chart view adapts to the number of problematic sites. To learn more, see Site endpoint status chart.
- Endpoint status details table: A detailed list of individual endpoints, including status, timestamps, extensions, assigned users, site location, IP addresses, data centers, and device details. To learn more, see Glossary: Endpoint status details. To learn more, see Glossary: Endpoints status details.


The Site Endpoint Status chart shows which sites have Offline endpoints.
A problematic site is a site that has one or more Offline endpoints.
The chart view adapts to the number of problematic sites:
- No problematic sites: When no site has offline endpoints, the chart is replaced by a confirmation message reading "No problematic sites found" (all endpoints are online), along with the total number of endpoints and sites currently online.
- Up to 29 problematic sites: A bar chart with one bar per site, sorted from the highest to the lowest percentage of offline endpoints. Each bar is split into online (green) and offline (red) portions.
- 30 or more problematic sites: A summary chart groups problematic sites into severity tiers so you can assess the scale of an issue at a glance.

Severity-tiers summary chart
The chart includes a severity-tier summary that groups sites by impact level, giving you an at-a-glance view of the most critical issues.
Click any severity tier to filter the chart and focus on the sites that matter most.
When 30 or more sites have offline endpoints, sites are grouped into four severity tiers based on the percentage of endpoints that are offline at each site:
|
Tier |
Offline endpoints at a site |
|---|---|
| Critical | 100% (all endpoints Offline) |
| High | 75% to 99% |
|
Medium |
25% to 74% |
| Low | 1% to 24% |
Each bar represents one tier. The number above each bar is the count of sites in that tier, and the red/green split shows the proportion of offline vs. online endpoints across those sites. Hover over a bar to see the number of sites and endpoints it represents.
Filter by site from the Summary chart
- Click any tier bar in the Site Endpoint Status chart. A side panel opens, listing the sites in that tier.
- Use the search box to find a site and select one or more sites.
- Click Apply to filter the entire report to those sites.
- Optional: Click Reset to clear your selection.
How endpoint status is determined
The endpoint status reflects the SIP![]() Session Initiation Protocol—a telecommunication protocol for signaling and controlling multimedia communication sessions. registration state of a device, indicating whether a VoIP device (IP phone, softphone) is actively connected and authenticated with a SIP server. It does not indicate a live presence signal.
Session Initiation Protocol—a telecommunication protocol for signaling and controlling multimedia communication sessions. registration state of a device, indicating whether a VoIP device (IP phone, softphone) is actively connected and authenticated with a SIP server. It does not indicate a live presence signal.
A device shows as online while it has an active registration, and offline once that registration ends. The registration ends in one of two ways:
- Graceful logout / unregister: When a device explicitly unregisters, for example a desk phone signing out, it is marked offline immediately.
-
Expiry timeout: If a device disconnects without unregistering (network loss, unplugged phone, closed laptop), it remains online until its registration expiry timer lapses without a renewal, then changes to offline.
Because of this, a device that drops off ungracefully can keep showing as online until its registration expires. Registration intervals depend on the device type and are configurable. Typical defaults are:
| Device type | Typica; registration interval |
|---|---|
| Polycom | Approximately 10 minutes |
| Yealink | Approximately 5 minutes |
| Softclient (app) | Approximately 30 minutes |
The Device Status dashboard includes interactive maps that help visualize endpoint distribution and service status by location. You can switch between the Site Location Map and the Routing Map to identify location-based service issues.
Site location map
The Site Location Map shows the geographic distribution of endpoints by site. Selecting a location displays how many endpoints are in service or out of service, helping you quickly understand site-level operational status.

Routing map
The Routing Map displays near real-time endpoint distribution and routing paths across regions. This view helps identify regional or routing-related service issues by showing where endpoints connect and how traffic flows.

You can tailor the Device Status dashboard to highlight the metrics most relevant to your work.

Filtering options
- PBX: Select the PBX to display relevant data. Your selection is saved for future sessions.
- Service Type: Online or Offline.
- Device Type: Primary Devices (VoIP Phones) or Secondary Devices (Softphones).
- Device Sites: Select the one or more sites.
- Reset all: Restore default filter settings with one click.
Note: Filter settings are saved and carried over to your next session.
To find more about how to customize a dashboard in Analytics for 8x8 Work, see Customize report settings.

Adjust time zone
Use the time zone selector in the upper-right corner to display accurate local operational time.
Select visible columns
To customize your table view:
- In the upper-right corner of the call table, click the Edit columns
 icon.
icon. - Drag metrics between Visible and Hidden columns.
- Reorder columns by dragging them up or down.
- Add or remove a column by clicking + or
 next to it.
 - Click Save to apply changes, or Reset to restore the default view.

Search for endpoints
Use the Search ![]() bar in the upper-right corner of the table to find endpoints by any available field, including extension, device owner, endpoint status, last register time, or site location. To clear a search, clear the search bar or refresh the page.
bar in the upper-right corner of the table to find endpoints by any available field, including extension, device owner, endpoint status, last register time, or site location. To clear a search, clear the search bar or refresh the page.
Sort column values
Click the arrow icon ![]() in the column header to sort data in any column alphabetically or numerically.
in the column header to sort data in any column alphabetically or numerically.
Refresh data and timing expectations
Data updates automatically every 60 seconds. You do not need to reload the page.
Status changes are not instantaneous. After an ungraceful disconnect, a device may continue to show as online until its registration expiry window lapses, plus up to one additional refresh cycle. The report reflects the last known registration state, not live presence.

The Device Status dashboard uses the following key fields and metrics to provide insights into endpoint availability and connectivity.
| Column |
Description |
|---|---|
| Extension | Phone system extension number associated with the endpoint |
| Device Owner | Assigned user of the extension |
| Endpoint status | Current service status of the endpoint |
| Last Register Time | The last time the device successfully registered or renewed its registration with the phone system. This is not a logout time. Physical phones re-register periodically, for example Polycom devices approximately every 10 minutes, so this value updates on a recurring interval even when the device is idle |
| Site Location | Site associated with the endpoint |
| Origin Public IP | Public IP address of the endpoint |
| Data Center | Data center used for routing |
| Data Center IP | Public IP address of the data center |
| User Device Details | Device identifier details other than MAC address |
| Mac Address | The MAC identifier |