Run the Active Calls dashboard
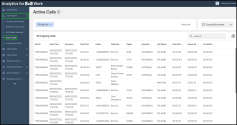
The Active Calls dashboard provides real-time visibility into ongoing calls.
- Modern design makes it easier to locate calls, monitor call activity in real-time, and access detailed interaction data.
- Replaces the legacy Active Calls report with a consistent user experience across 8x8 products.
- Displays live call information such as caller, callee, call time, duration, and more.
Important! The new dashboard does NOT contain historical data.
Features
Modern interface: Enhanced call status labels.
Call journey visibility: Status and call flow shown in both the main table and the call details panel.
Advanced search: Find calls quickly by caller, caller name, or callee.
Expanded details: Interaction, caller/callee details with service and device metrics have been moved to the right side.
Redesigned layout: The call Interaction Details panel moved to the right side.
PBX![]() Private Branch Exchange—a private telephone network used within a company. filter: Filter data when multiple PBXs are available.
Private Branch Exchange—a private telephone network used within a company. filter: Filter data when multiple PBXs are available.
Filters and persistence: Your filters and columns remain when navigating away.
Limitations
- Export to CSV or Excel is not available.
- Leg ID and specific redirect/service details are not included.
- The manual refresh button has been removed. Data automatically updates every five seconds..
- The dashboard shows real-time data only (no historical view).
Run the report
- Log in to Analytics for 8x8 Work.
-
From the menu, go to Call Report > Active Calls.
Note: The dashboard automatically refreshes every 5 seconds. To force a refresh, reload your browser tab.
- Customize the dashboard for better real-time call monitoring.
You can customize the dashboard and display the relevant metrics for your report.
Filter by PBX
- User the PBX selector in the upper-left corner to filter report data by a single PBX.
- If only a PBX is available, it is selected by default.
Adjust time zone
- Use the time zone selector in the upper-right corner to display accurate local operational time.
Select visible columns
- Click
 in the upper-right corner of the calls table.
 -
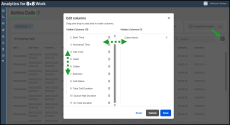
In the Edit columns dialogue:
- Visible/Hidden columns: Drag metrics between these columns to choose what appears in the dashboard.
- Column order: Drag metrics up or down to change their order in the dashboard.
- Quickly add or remove a column by clicking + or
 next to it.
 - Use Cancel todrop the changes or Reset to restore the default view.
- Click Save.
Search for calls
- Use the Search
 bar in the upper-right to find calls by caller, caller name, or callee.
 -
Sort column values
-
Sort data in any column alphabetically or numerically:
-
- Click the arrow icon
 in the column header to reorder values.
- Click the arrow icon
Refresh data
- The dashboard auto-refreshes every 5 seconds.
- Use browser refresh to manually reload data.
| Column | Description |
|---|---|
| Call ID | A unique identification number that ties together all legs of the original call |
| Start Time | The time the call started. A call begins as soon as the caller goes off-hook to dial |
| Answered Time | The time when the call was answered |
| Talk Time | This updates automatically every five seconds, but the user can also manually refresh the browser if needed. |
| Caller | The phone number of the caller |
| Caller Name | The name of the extension from which the call originated |
| Callee | The phone number of the called party |
| Direction | Indicates whether the call is Incoming, Outgoing, or Internal. |
| Call Status | Reflects the current status of the call as part of its journey. Possible labels include: TALKING, WAITING, ALERTING, MISSED, REJECTED, ONHOLD, TRANSFERRED, DISCONNECTED, IN SCRIPT, FINISHED. |
| Total Call Duration | Duration of the call from start time until now |
| Queue Call Duration | The total time the caller spent waiting in a queue |
| On Hold Duration | The total time the call was placed on hold |
When you select a call in the dashboard, the call details panel opens on the right side, showing more granular call data.
| Metrics | Description |
|---|---|
| Interaction Details | |
| Caller ID | Unique identification number for the call. |
| Reference Call ID | The Call ID of the original or transferred call. Populated only for transfers. |
| Direction | Indicates if the call is Incoming, Outgoing, or Internal |
| Labels | Shows the various statuses the call has been in (for example, TALKING, WAITING, ALERTING, ONHOLD, TRANSFERRED, DISCONNECTED). |
| SIP |
Session Initiation Protocol Call ID used for signaling. |
| Caller Details | |
| Caller | Extension from which the call originated. |
| Caller Name | Name of the caller |
| Caller ID | Caller’s number and/or name. |
| Callee Details | |
| Callee | Phone number of the called party |
| Callee Name | Name of the called party |
| Callee device ID | Unique identifier of the callee’s device, if available |
| Callee Device Model | Device model used by the callee for this call leg. |

