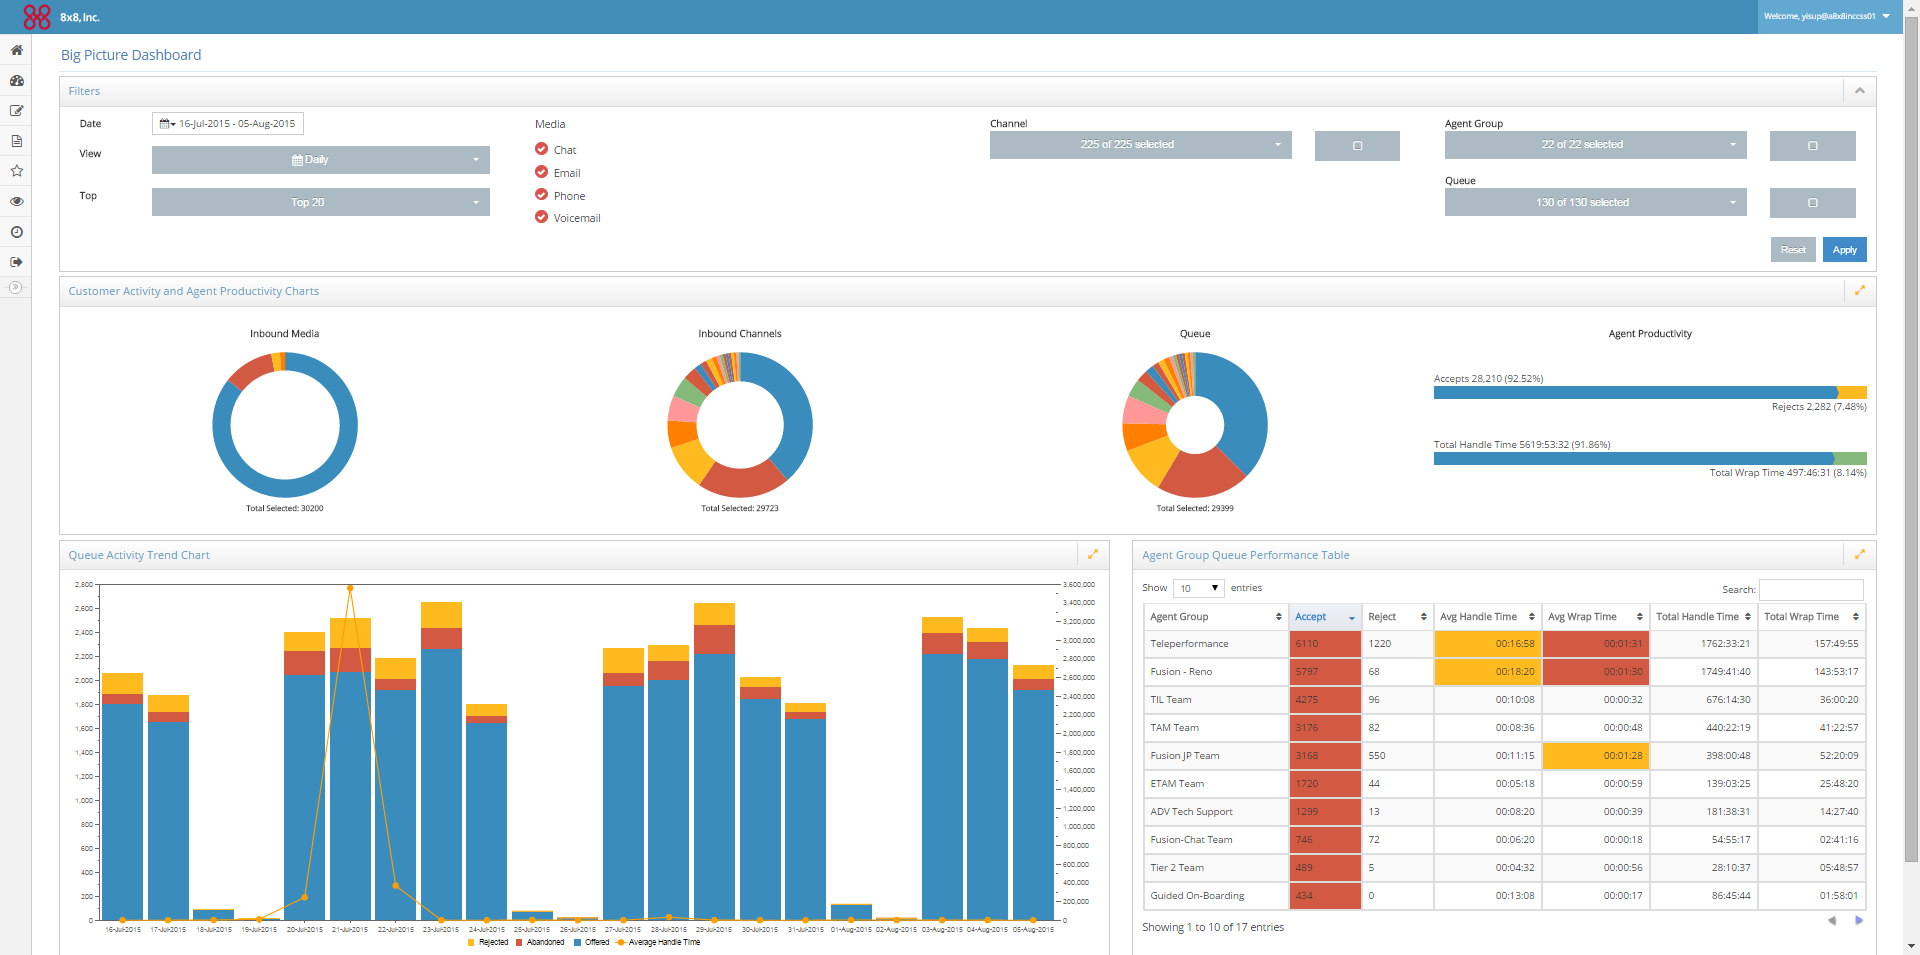
The Big Picture Dashboard provides a snapshot of contact center performance by relating customer traffic, through queues and media channels, to the agent groups who service them. You can track the volume of interactions that enter queues by the interaction medium.
Note: The dashboard does not capture calls that entered IVR and got abandoned before entering the queue.
This dashboard has three data charts that offer the desired interactivity:
Customer activity and agent productivity is represented by the following donut charts: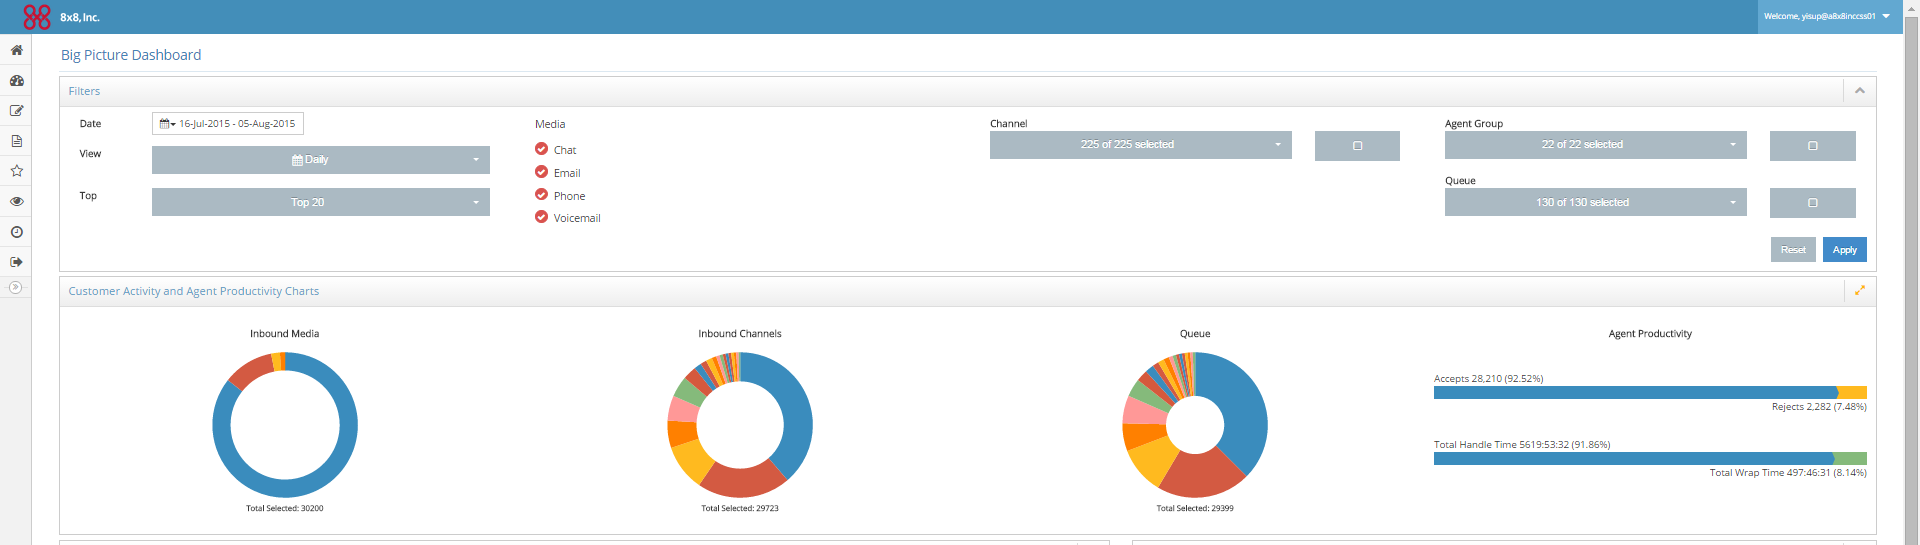
All these donut charts function as filters (Media Inbound, Channel Inbound, and Queue Inbound). It is possible to use two or three donut filters at the same time, such as to observe only voice and Sales queue group performance.
For example, To observe Sales agent group performance for phone interactions, select the Phone slice of the Media Inbound donut chart, filtering the entire dashboard to only show voice interactions. This means the Media Inbound chart would display 100% voice-only data. The Channel Inbound chart would filter out email and chat channels, and display 100% voice-only data. Similarly, the Queue Group chart shows queues that serve only voice interactions. The Agent Productivity bar graph then refers to voice-only performance.
Agent productivity is measured by key performance indicators, such as the number of calls accepted, number of calls rejected, total handle time, and total processing time. You can track the time taken for post processing to determine agent productivity.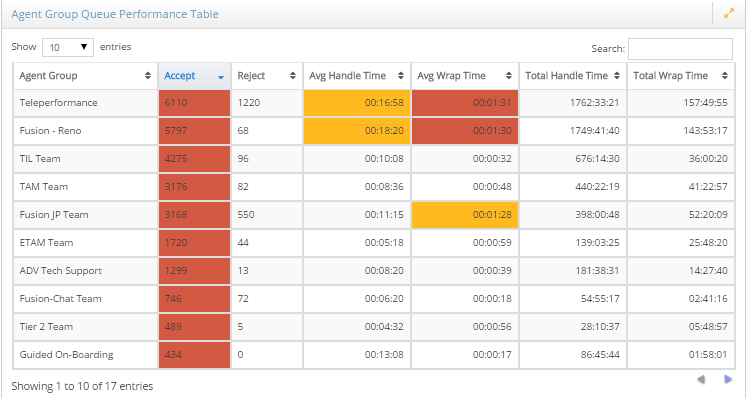
Note: Post processing time is summed up as Total Wrap Time. The data is cumulative for all agents.
The Agent Group Queue Performance table offers the following metrics by agent group:
This chart explains volume of interactions, rejections, abandons, and SLA % by specific queues over time. This chart supports the Queue Group chart by explaining performance over time, as well as showing the specific queues that make up the queues shown in the Queue Group chart.
The entire dashboard is governed by the following drop down filters:
You can filter data in the dashboards as desired, and save these preferences for each dashboard. These filters are remembered across login sessions. You can reset to default settings with just a click.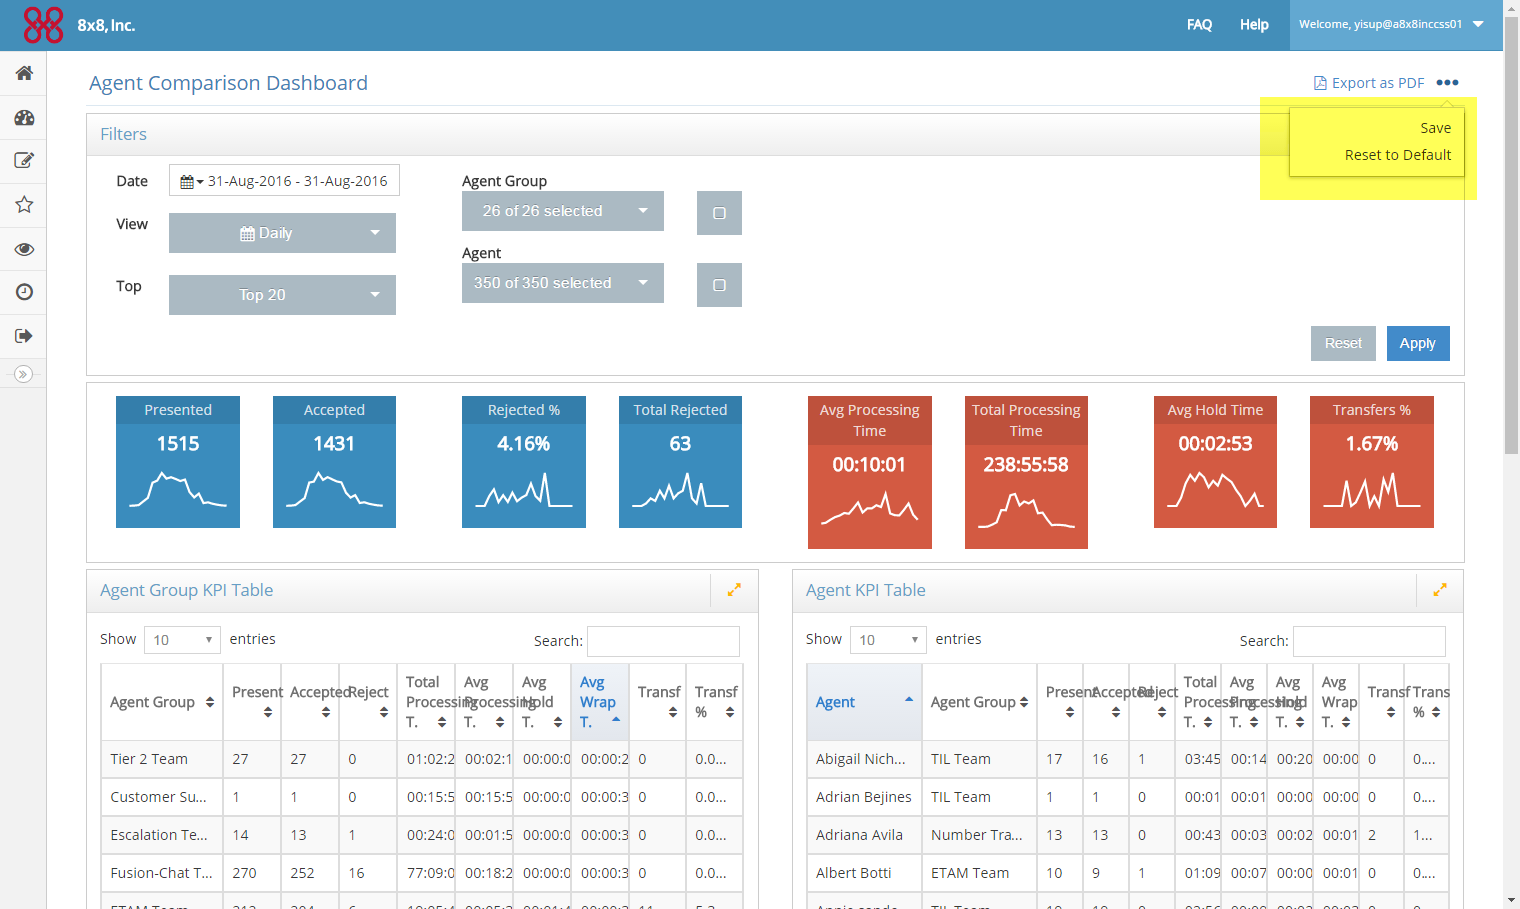
|
Follow us on
|
Contact us
|