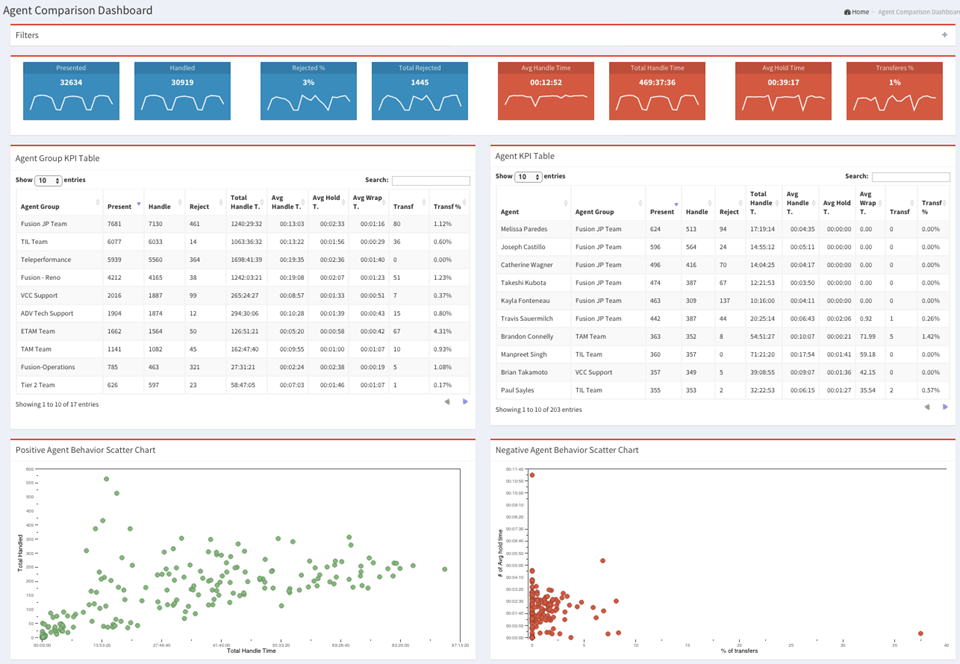
This dashboard explains performance of agent groups and individual agents with a graphical focus on positive and negative agent behavior. This gives an overview of metrics for agent productivity by agent group, and further by agents. You can look at the stats, and compare the productivity of groups and agents as needed.
Agent performance can be assessed by the metrics indicated in agent group tables. The dashboard provides:

The Agent Behavior scatter charts explain the pattern of positive agent behavior or negative agent behavior of agents as measured by the number of calls handled, total talk time, total hold time, and transfers. This allows the user to focus on extremes, such as too few calls handled, too much total talk time, too much hold time, or a high percentage of transfers.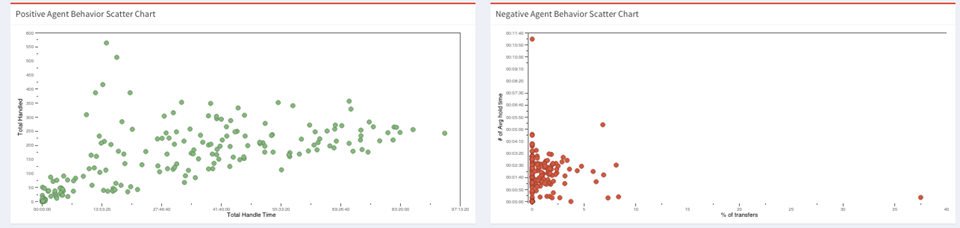
Rob is a contact center manager who wants to check the performance of some newly-hired agents in the Sales Team #2 Agent Group. He is especially concerned about their progress on a recent Marketing campaign in terms of taking Sales calls with customers.
Rob opens the Agent Comparison dashboard, selects the date of the recent Marketing Campaign #1, and chooses Sales Team Agent Groups #1, #2, and #3. He has access to the following data:
|
Follow us on
|
Contact us
|