As a contact center supervisor , do you need to review the performance of your agents periodically? Do you want to drill down their activity history monthly, weekly, and hourly to understand and address any challenges? What’s the number of phone calls offered, accepted, rejected, abandoned by an agent? What’s the average handling time of calls this past hour? How long have the agents been busy since morning? and more. The new Agent Interactions report by 8x8 Analytics offers you historical data of agent activity which answers all these questions.
Access the report out of the box using the default template and create a custom report tailored to your business needs. This report offers insight into agent behavior and presents metrics on the time invested by the agents on specific interactions.
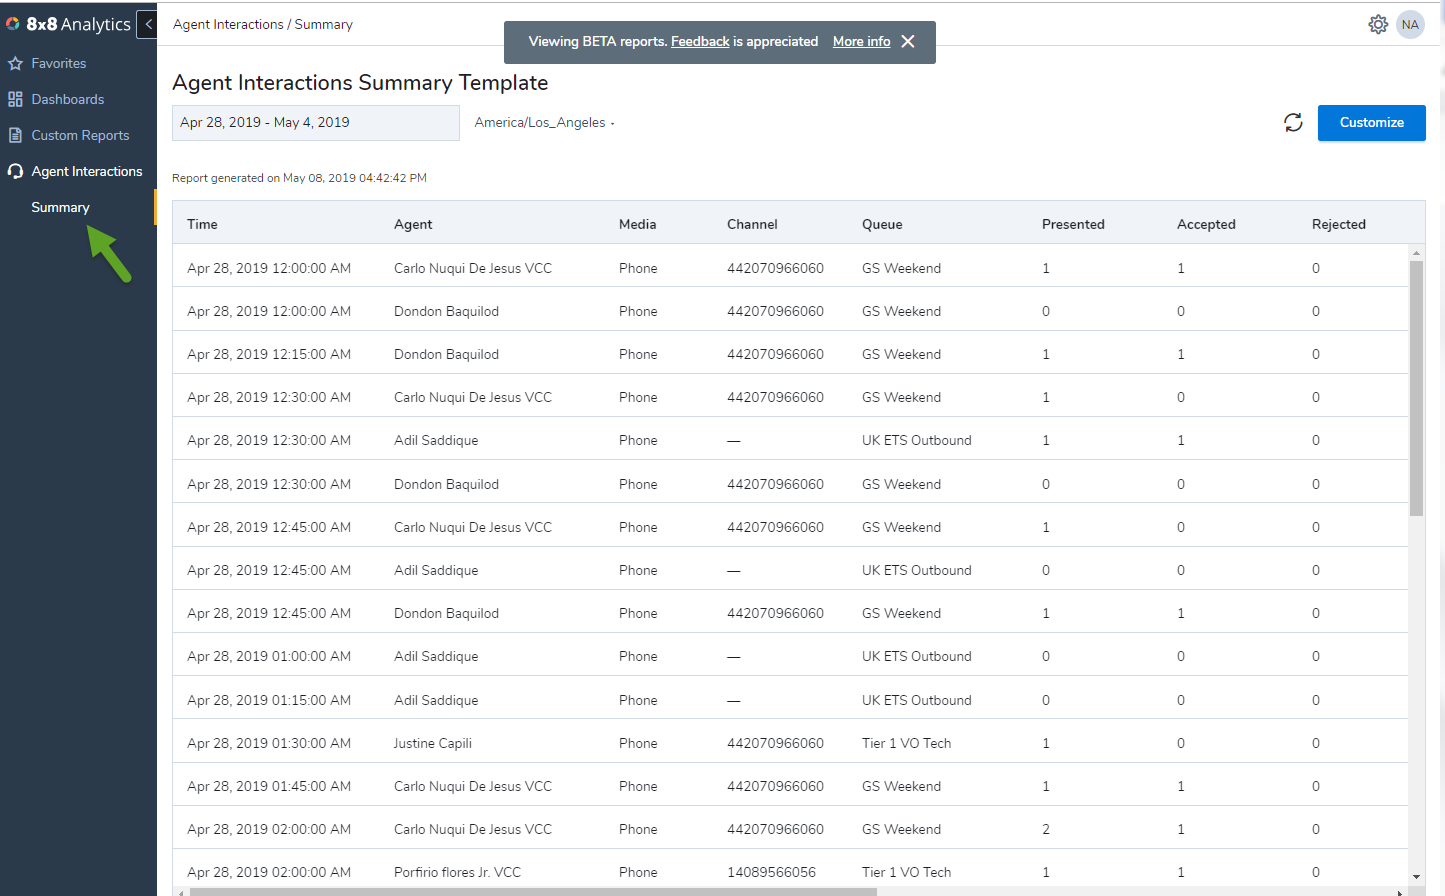
NOTE: The Agent Interactions Summary report provides you data similar to the historical VCC reports such as “Transactions”, “Transactions per media”, “transactions per channel per queue”, ”transactions per media per queue”, and “transactions per media per channel per queue”.
By default, the data is presented for the past week. To customize date range, time zone, or metrics, you must customize the template.Learn more about customizing the template.
To access the glossary of metrics, click here.
By default, the data is presented for the past week. You can customize the report to match the needs.
To tailor the Agent Interactions Summary report to suit your business needs, you must customize the default template and save it. Once saved, it shows up as a custom report.
Select the following dimensions and save your settings.
Metrics: Select from the available metrics.
Agents: Select all or select desired agents individually. Rearrange metrics as desired; as well as reset to the default order.
Media: Do you want to filter data by media? Say you want to review the phone call history handled by an agent, select Phone media. If Robin serves phone interactions most of his work day and addresses chat traffic during late evenings, you can access the call and chat activity by filtering on media type.
Queue: Wish to access data for specific queues? If Robin serves customer support tier 1 queue but handles tier 2 traffic occasionally, you can track John’s activity on both queues or select the desired queue
Report layout: The report layout allows you to display data based on specific dimensions. Do you want to view agent interactions based on media type, queues, and channels? Select the desired report layout for an insight into the metrics.
Agent: I want to see the total number of interactions handled by agents yesterday. This includes all media, queues, and channels. Robin accepted a total of 400 interactions yesterday.
Agent & Media: I want to access agent activity aggregated by media type. Let’s say Robin handled a total of 400 interactions yesterday. How many of them are phone, chat, and voicemail interactions? You can filter further to include only phone and voicemails, but not chat.
Agent & Media & Queue: I want to view agent activity data based on media and queues. Example: I want to access metrics of the phone and chat activity handled by agents serving customer support tier1 and tier2 queues this past week.
Agent & Media & Channel: I want to view agent activity on toll-free phone channels <1-8xx-23xx> <1-877-2xx4> dedicated to serving tier 1 customers.
Agent & Media & Channel & Queue: I want to view agent activity via chat dedicated to billing inquiries in New York and San Francisco. Further, I want to drill down to look at data for new customer queues.
After customizing the report, save it to access it under Custom reports.
|
Follow us on
|
Contact us
|